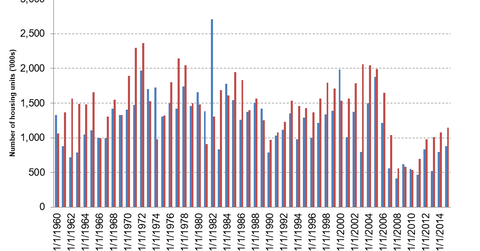
Limited Supply: Analyzing Housing Starts and Household Formations
There was a big fall in household formation in 2008. In 2005, household formation peaked at 1.9 million. By 2008, that number was just over 400 million.
March 9 2016, Updated 1:05 p.m. ET

Is the first-time homebuyer awakening?
The Great Recession wasn’t kind to the Millennial generation. The biggest challenge was a lousy job market for recent college graduates. Finishing college with a degree, large amounts of student loan debt, and bleak job prospects forced many young adults to move back home with their parents or take on roommates in a multi-bedroom apartment.
You can see this in the above chart. There was a big fall in household formation in 2008. In 2005, household formation peaked at 1.9 million. By 2008, that number was just over 400 million. It was less than a quarter of its previous high three years earlier. To put these numbers in perspective, the average from 1990 to 2005 was about 1.3 million. It averaged around 627,000 after the peak. In 2015, household formations were about 900,000 and housing starts were about 1.1 million. Still, when you factor in obsolescence and other factors, the lack of construction makes the housing market extremely tight.
You can compare the Baby Boomer household formation in the 1970s and 1980s to the current Millennial formations. This is even clearer when you consider that the Millennial generation is bigger than the Baby Boomers. The drop-off in household formation wasn’t driven by fertility rates 25 years ago. It was driven by a lousy economy and represents pent-up demand.
So far, it looks like Millennials are choosing to be renters. This could be a function of many things, like a tight credit market, high student loan debt, or simply that the Millennial generation prefers low commitment and urban living. Given the qualified mortgage regulations out of Washington, D.C., lenders have strict debt-to-income constraints if they want to limit their liability in case the borrower defaults.
First-time homebuyer accounted for 32% of existing home sales
In January, the share of existing home sales attributable to the first-time homebuyer was 32%—flat with December and up from 28% a year ago. Historically, this was closer to 40%. So, the action has been in the move-up buyer and luxury buyer. Builders like Lennar (LEN) have a big exposure to the move-up buyer. Toll Brothers (TOL) focused on luxury single-family residences. However, it has been developing its multi-family business too. Other builders, including D.R. Horton (DHI) and PulteGroup (PHM), have more exposure to the first-time homebuyer.
The question is whether the Millennials decide to stay urban or move to the suburbs. If it’s the former, then Toll Brothers is positioned well. If it’s the latter, look to the first-time homebuyer builders to participate in what amounts to huge pent-up demand. If you don’t want to segment your bet on housing, you can invest in the sector with the SPDR A&P Homebuilders ETF (XHB).
