PetroChina Co Ltd
Latest PetroChina Co Ltd News and Updates
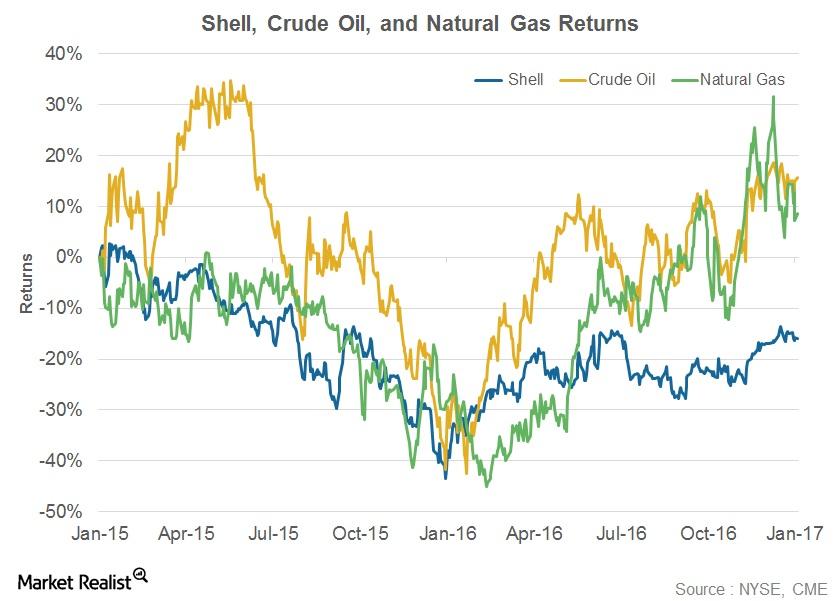
How Has Shell’s Stock Performed ahead of Its 4Q16 Earnings?
On January 20, 2016, Shell began recuperating from the falls it had experienced in the previous year. Shell has risen 49% since January 20, 2016.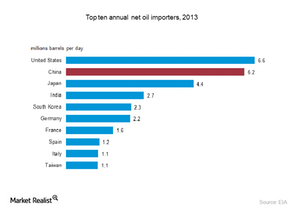
Who will drive crude oil consumption?
Current lower oil prices and growth from China, India, the United States and Asia Pacific countries will drive crude oil consumption in the long term.Industrials Why China’s slowing consumption demand is an important threat
Real estate and construction are the two important drivers of China’s economic growth. They account for more than 20% of China’s gross domestic product (or GDP) when you also factor in cement, steel, chemicals, furniture and other related industries.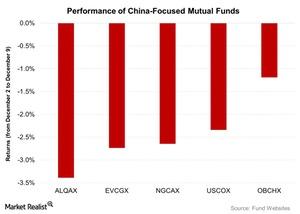
SSE Composite Index Falls despite China’s New IPO System
The SSE Composite Index fell by 1.8% from December 2 to December 9 and closed at 3,472.44 on December 9, 2015.Consumer Overview: What is Pipelineistan?
As percentages of the worlds’ total reserves, Russia holds 45% of the gas, 23% of the coal, 14% of the uranium, and 13% of the oil. Currently, Russia is the world’s largest energy supplier.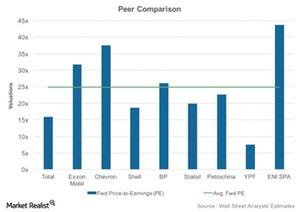
Total’s Forward Valuation: Peer Comparison
In the previous part of this series, we discussed Total’s historical valuation trends. Now we’ll compare its forward valuation with that of its peers.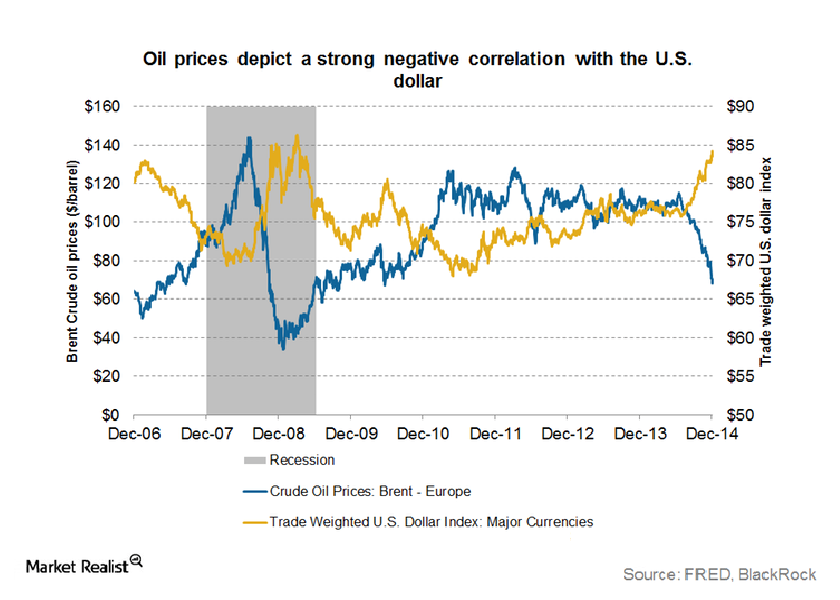
How the strengthening US dollar is impacting crude oil prices
The US dollar plays a major role in the price movements of commodities such as gold and crude oil. A strengthening US dollar is often seen as negative.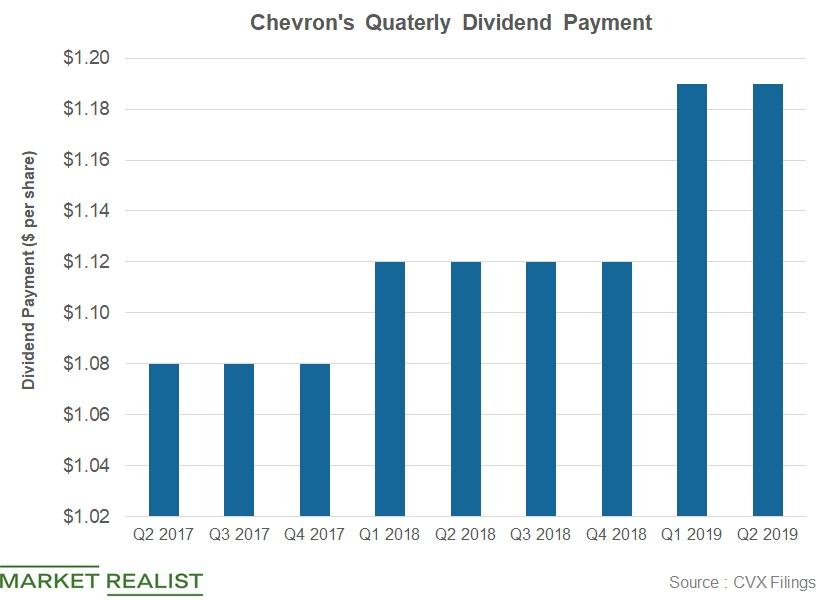
How Will Chevon’s Dividend Payment Trend in Q2?
Chevron (CVX) released its first-quarter earnings on April 26. The company paid $2.2 billion in dividends in the first quarter.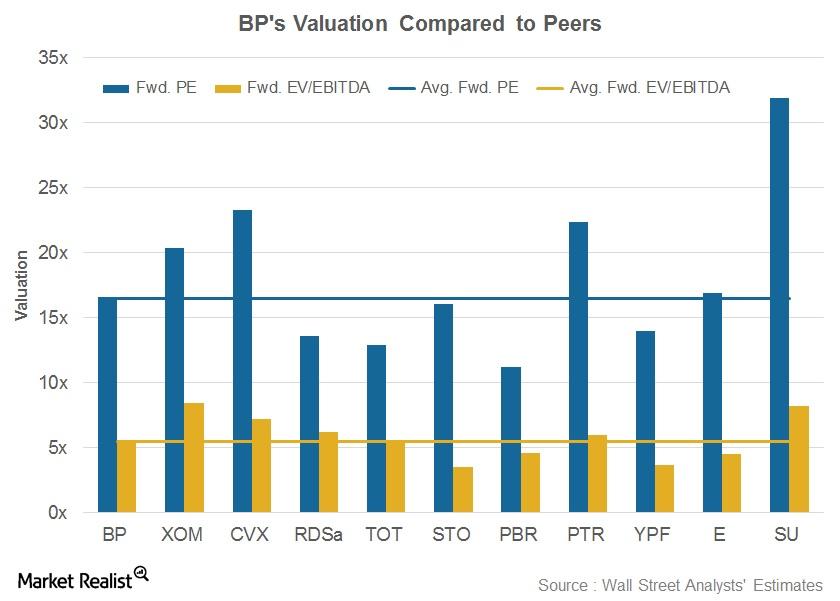
What’s BP’s Valuation?
BP (BP) is now trading at a forward PE (price-to-earnings ratio) of 16.6x, above its peer average of 16.5x.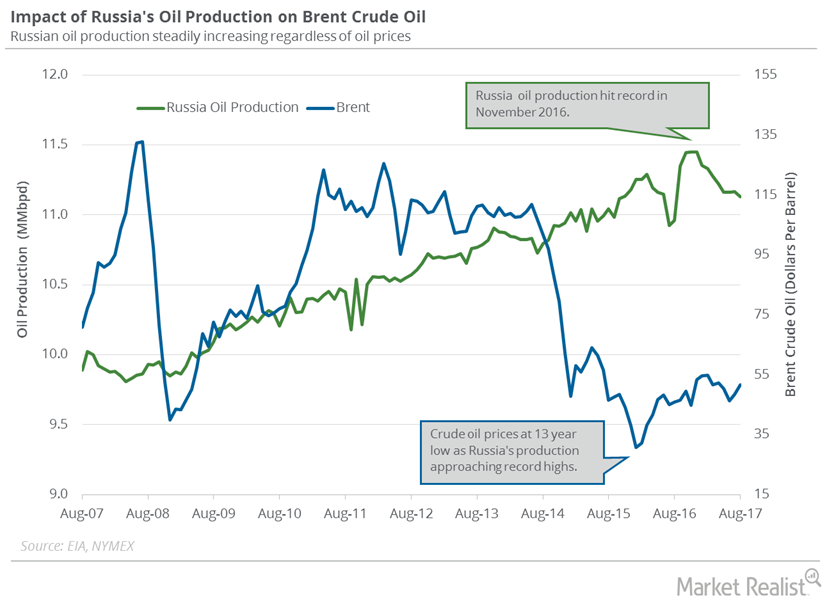
Russia’s Crude Oil Exports Could Pressure Oil Futures
Russia’s energy ministry estimates that the country’s crude oil exports rose 2% or by 160,000 bpd (barrel per day) in the first nine months of 2017.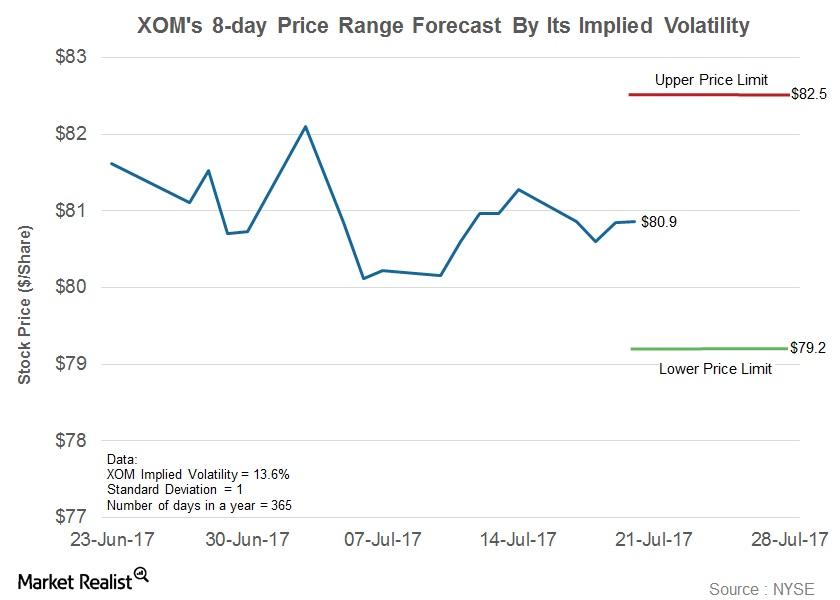
What’s the Forecast for ExxonMobil’s Stock Price?
Implied volatility in ExxonMobil has fallen from 14.9% on April 3, 2017, to 13.6% to date.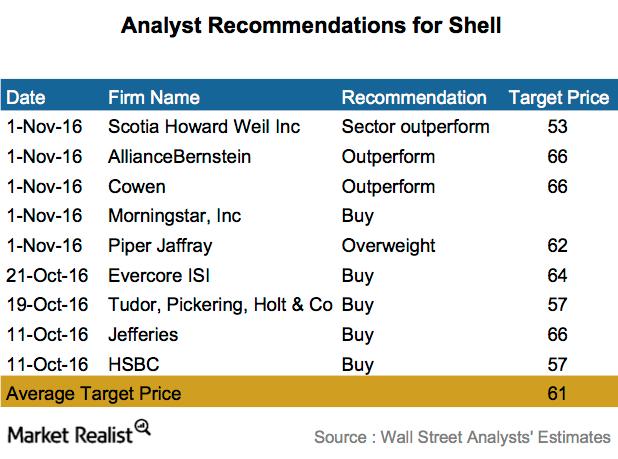
Analysts’ Recommendations for Shell: Most Say ‘Buy’
Shell’s highest and lowest 12-month price targets stand at $66 and $53. It indicates a 27% and 2% rise from its current levels, respectively.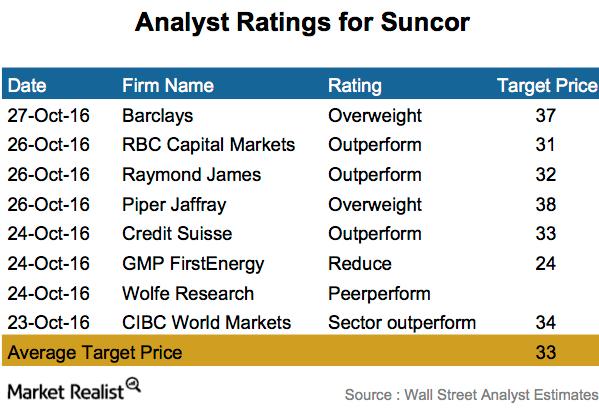
Suncor: How Analysts Are Rating the Stock after Earnings
An analyst survey shows that six out of eight companies surveyed rated Suncor Energy (SU) an “overweight” or “outperform.”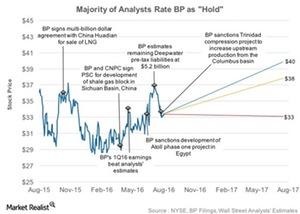
Why Most Analysts Recommend ‘Holds’ on BP
Analysts’ ratings for BP (BP) show that 31% of those covering the stock rate it as a “buy,” and 61% rate it as a “hold.”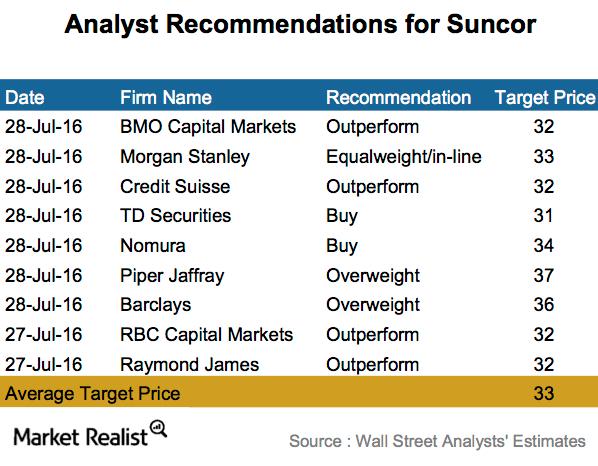
Majority of Analysts Rate Suncor a ‘Buy’ after 2Q16 Earnings
Analyst surveys show that eight of the nine analysts surveyed rated Suncor (SU) a “buy,” “overweight,” or “outperform.”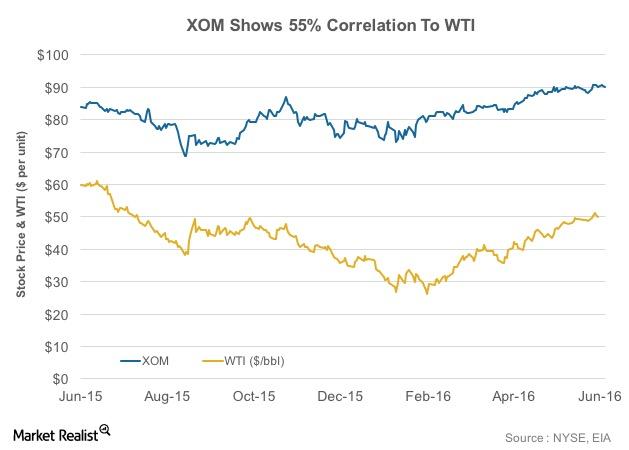
What’s the Correlation between XOM’s Stock and Crude Oil?
Integrated energy companies such as ExxonMobil (XOM) are affected by volatility in crude oil prices. To what degree? This varies from company to company.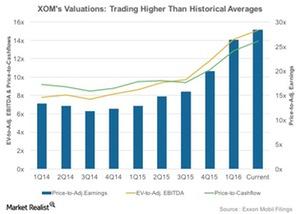
Why ExxonMobil’s Valuations Are Higher Than Historical Averages
ExxonMobil’s price-to-earnings (or PE) ratio has generally shown an uptrend in the past two years. In 1Q16, the stock traded at a PE of 26.4x.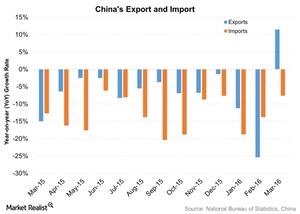
China’s Exports Jump: Can the Growth Be Maintained?
According to the General Administration of Customs, China’s exports, in US dollar terms, jumped 11.5% YoY (year-over-year) in March.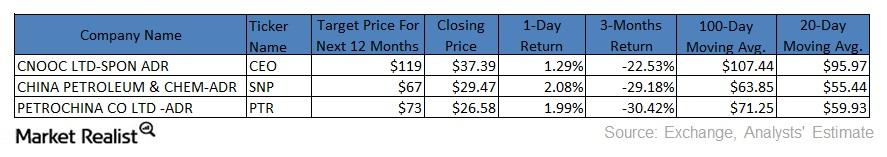
Moving Average Analysis of Chinese Energy Companies
Chinese energy companies CNOOC, China Petroleum & Chemical, and PetroChina Company have fallen below their 100-day and 20-day moving averages.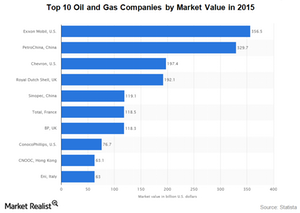
Bearish Crude Oil Market Has Put $5 Trillion at Risk
The depressed energy market has erased just over $1 trillion of market capitalization from oil and gas companies around the globe.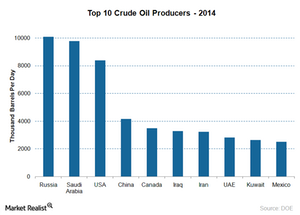
How Top Crude Oil Producers Impact the Crude Oil Market
The world’s largest producer of crude oil is Russia. It is also among the largest crude oil exporters.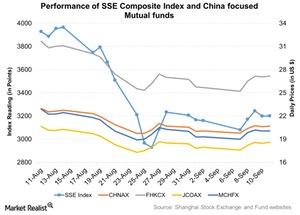
Turbulence in China’s Stock Market
Due to recent stock market turbulence in China’s stock market, the SSE (Shanghai Stock Exchange) Composite Index was down 22.7% month-over-month and ended at 3,200.23 points on September 11.