California Resources Corporation
Latest California Resources Corporation News and Updates
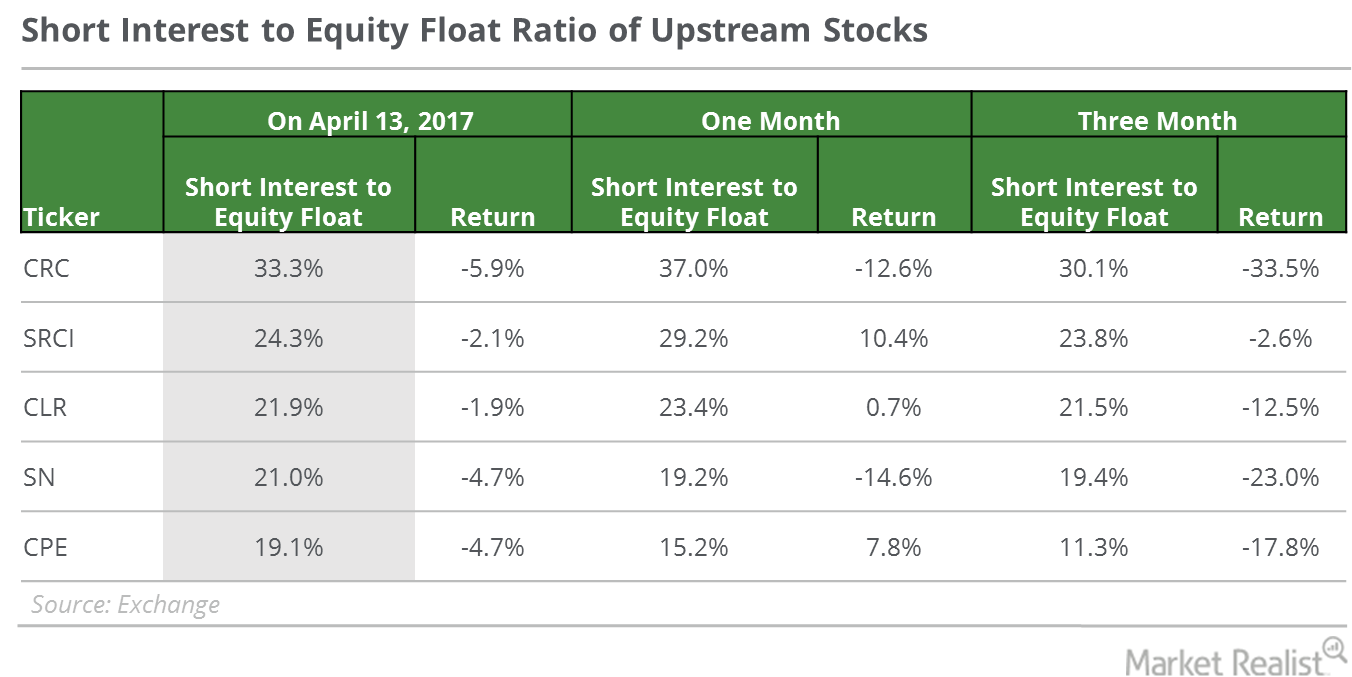
Why the Numbers Look Bearish for These Upstream Stocks
All these upstream companies have seen the short interest in their stocks rise—an potential indication of market skepticism in these companies’ abilities to profit from oil’s recent gains.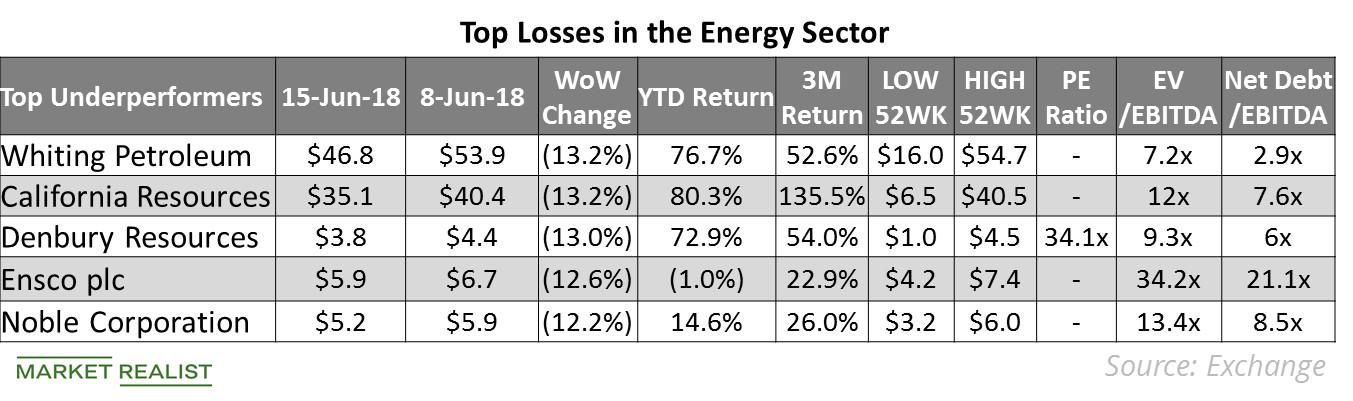
Top Energy Losses Last Week
On June 8–15, Whiting Petroleum (WLL) and California Resources (CRC) fell the most on our list of energy stocks.
Are You Looking at the Right Oil-Weighted Stocks?
On May 16, US crude oil June futures rose 0.3% and closed at $71.49 per barrel, a more-than-three-year high.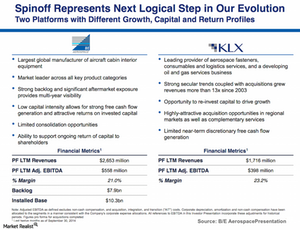
B/E Aerospace spun off KLX business on activist push
On December 17, 2014, B/E Aerospace completed its spin-off of KLX, Inc., from B/E Aerospace, and KLX started trading on NASDAQ under the ticker symbol KLXI.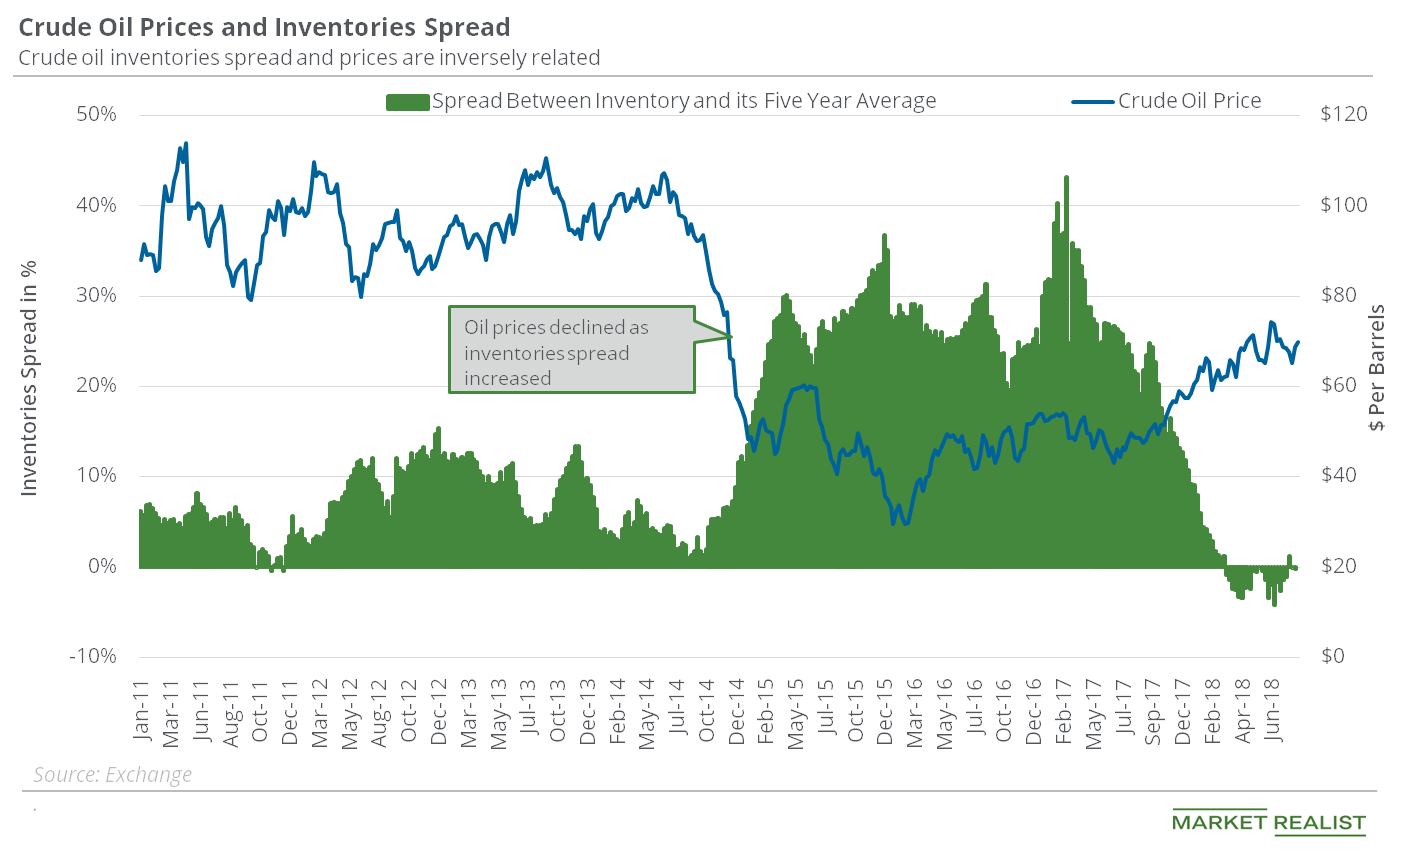
Why Inventory Data Might Boost Oil Prices
In the week ended August 31, 2018, US crude oil inventories were almost on par with their five-year average.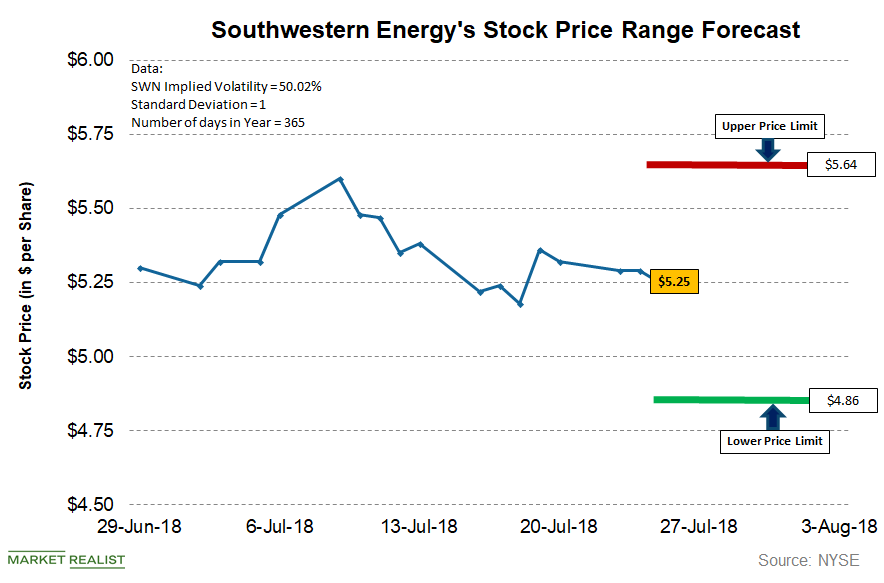
What’s the Forecast for Southwestern Energy Stock?
As of July 25, Southwestern Energy (SWN) had an implied volatility of ~50.0%, which is lower when compared with its implied volatility of ~50.9% at the end of the second quarter of 2018.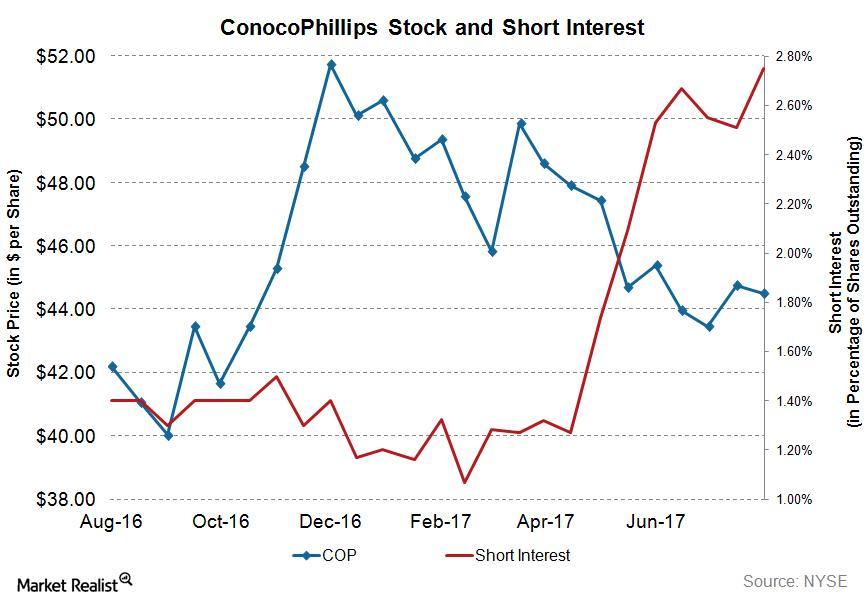
Who’s Shorting COP: Reading the Short Interest in ConocoPhillips’s Stock
Short interest in COP On August 14, 2017, ConocoPhillips’s (COP) total shares shorted (or short interest) stood at ~33.4 million, while its average daily volume was ~8.02 million. This means the short interest ratio for COP’s stock was ~4.6x. COP’s average daily volume is calculated for the short interest reporting period from August 1, 2017, […]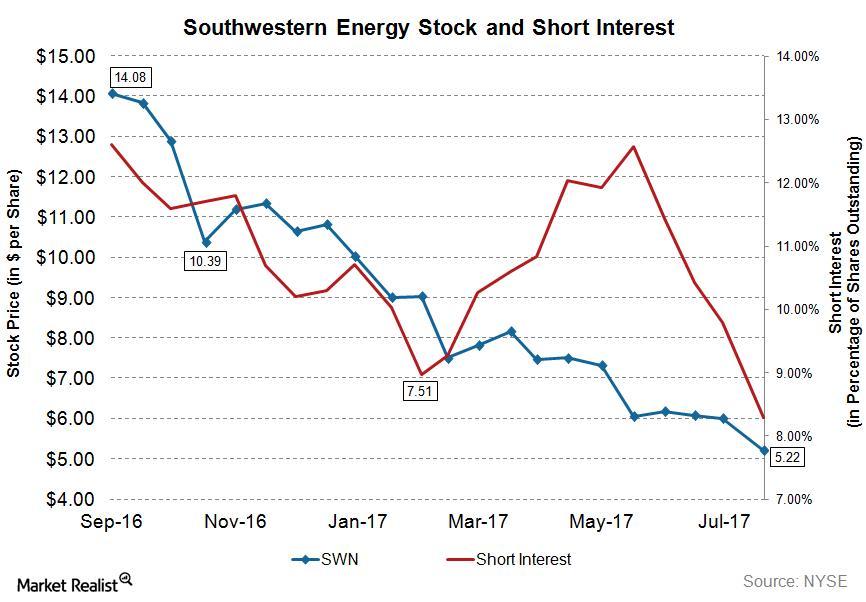
Analyzing the Short Interest in Southwestern Energy Stock
As of August 14, Southwestern Energy’s total shares shorted (or short interest) stood at ~45.89 million, while its average daily volume is ~17.44 million.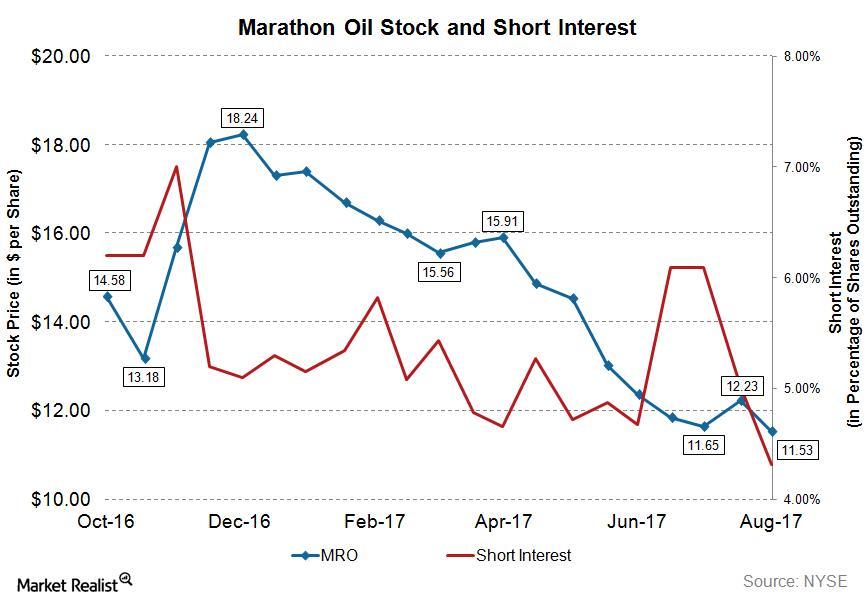
Short Interest in Marathon Oil Stock Remains at Lower Levels
As of August 14, 2017, Marathon Oil’s total shares shorted (or short interest) stood at ~36.65 million, while its average daily volume is ~15.94 million.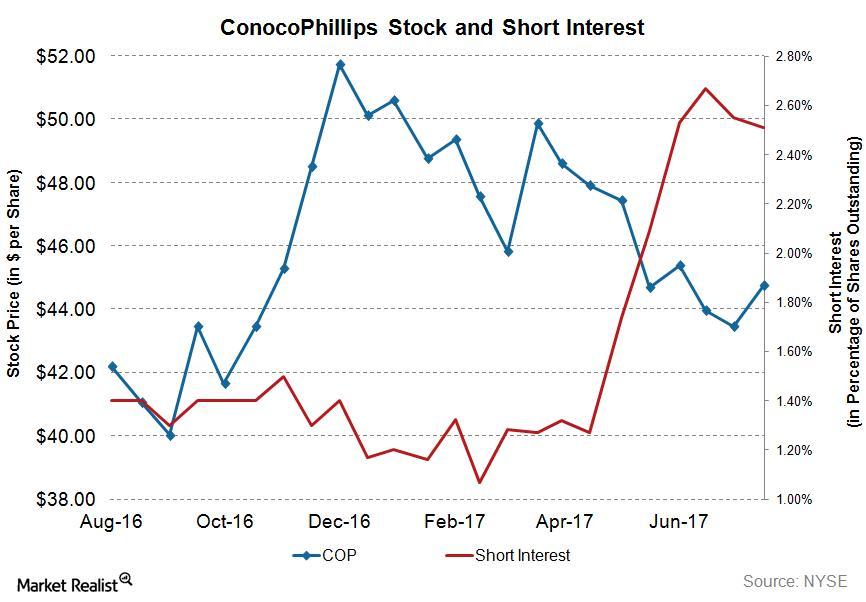
Analyzing the Short Interest in ConocoPhillips Stock
As of July 31, 2017, ConocoPhillips’s (COP) total shares shorted (or short interest) was ~31.6 million, and its average daily volume was ~8.0 million.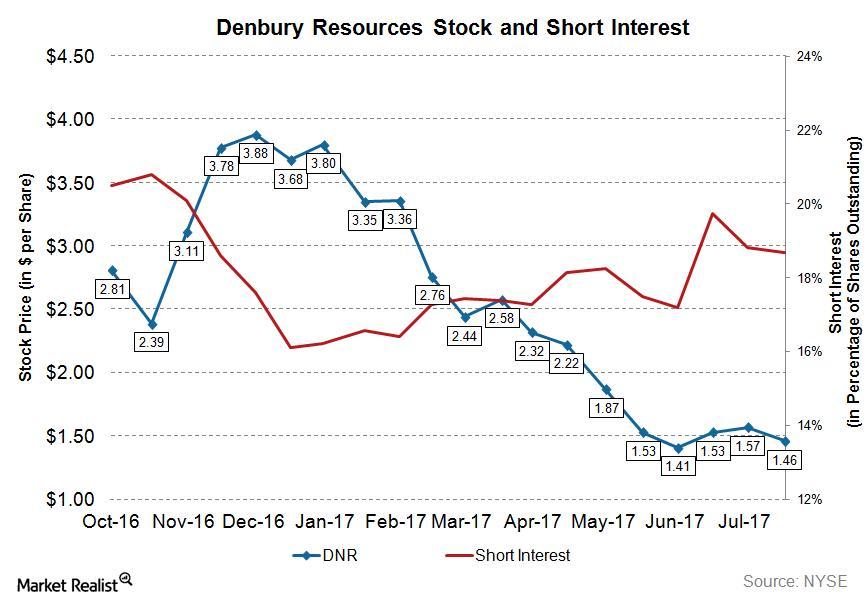
Analyzing Short Interest in Denbury Resources Stock
Denbury Resources’ short interest ratio has a 52-week high of ~12.3x and a 52-week low of 5.8x.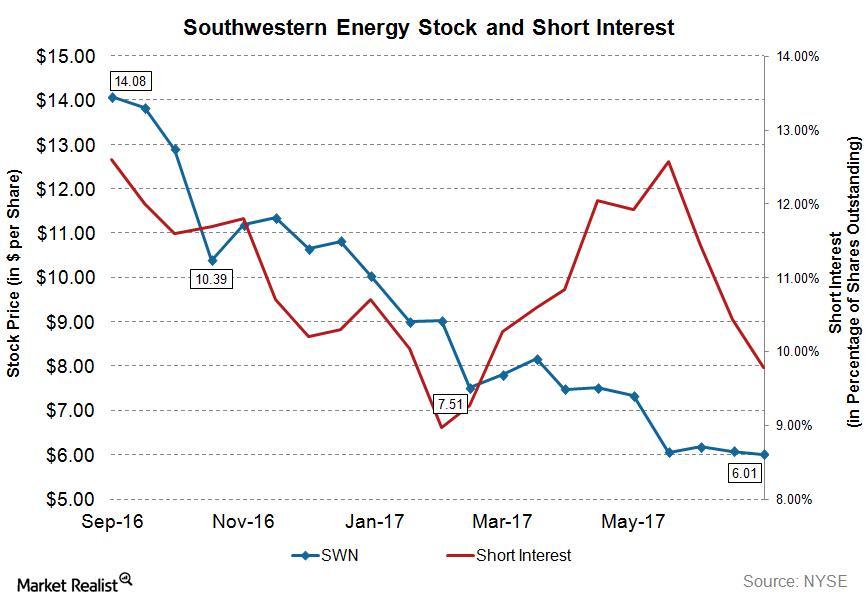
What’s the Short Interest in Southwestern Energy Stock?
As of July 14, 2017, Southwestern Energy’s (SWN) total shares shorted (or short interest) stood at ~49.5 million, whereas its average daily volume was ~18.4 million.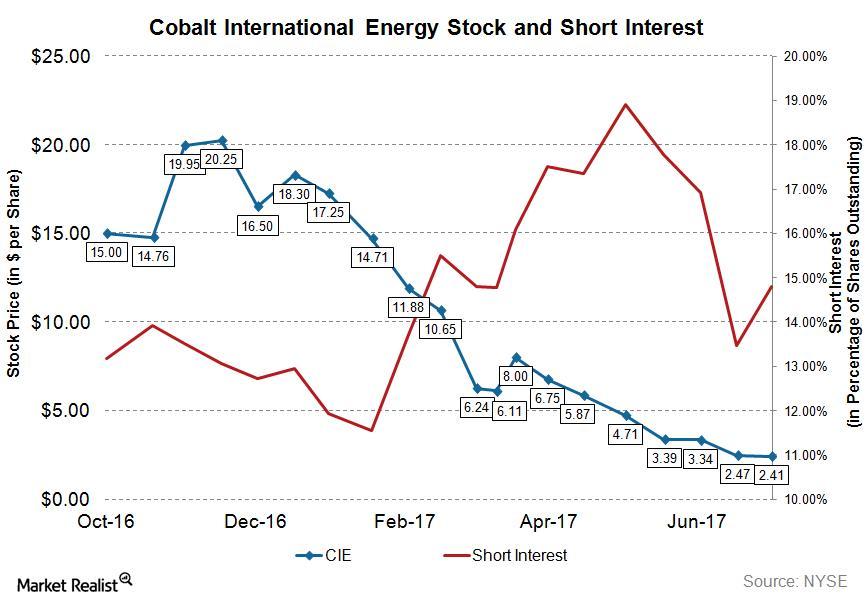
Analyzing Short Interest in Cobalt International Energy’s Stock
As of July 14, 2017, Cobalt International Energy’s (CIE) total shares shorted (or short interest) was 4.37 million, whereas its average daily volume is 1.03 million.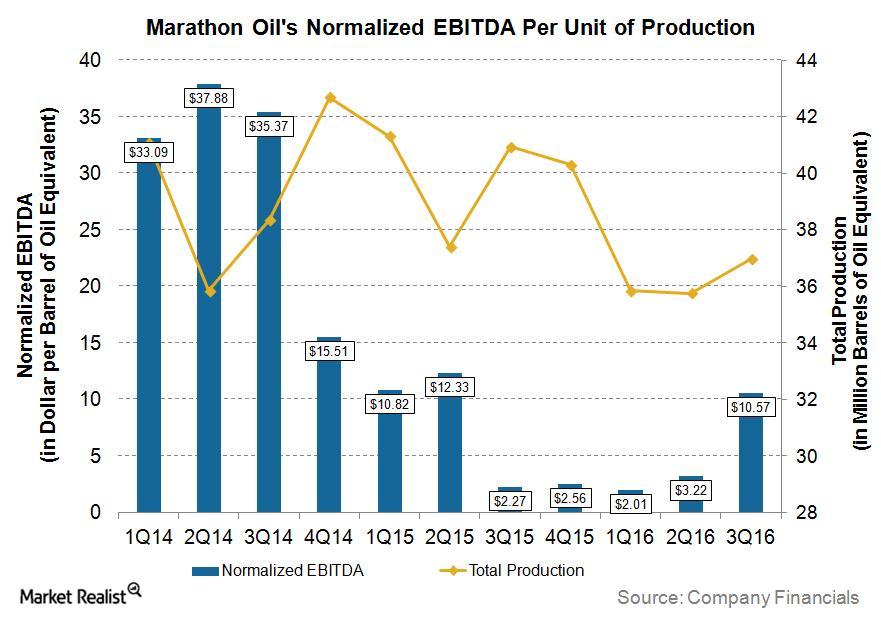
Understanding Marathon Oil’s EBITDA Normalized to Production
In 3Q16, Marathon Oil (MRO) reported normalized EBITDA per unit of production of ~$10.57 per boe, which was ~366% higher than in 3Q15.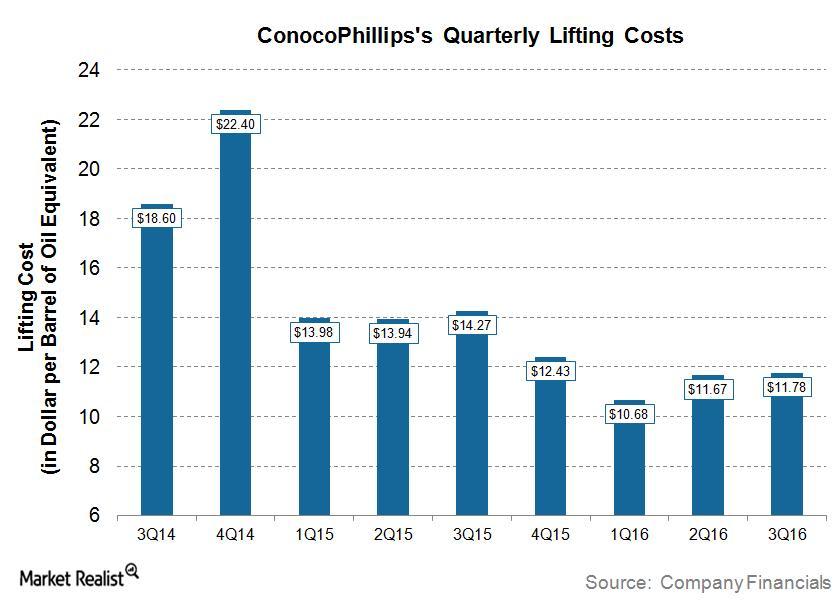
Analyzing ConocoPhillips’s Lifting Costs
In 3Q16, ConocoPhillips (COP) reported lifting costs of ~$11.78 per boe (barrel of oil equivalent), which is ~17.0% lower than 3Q15.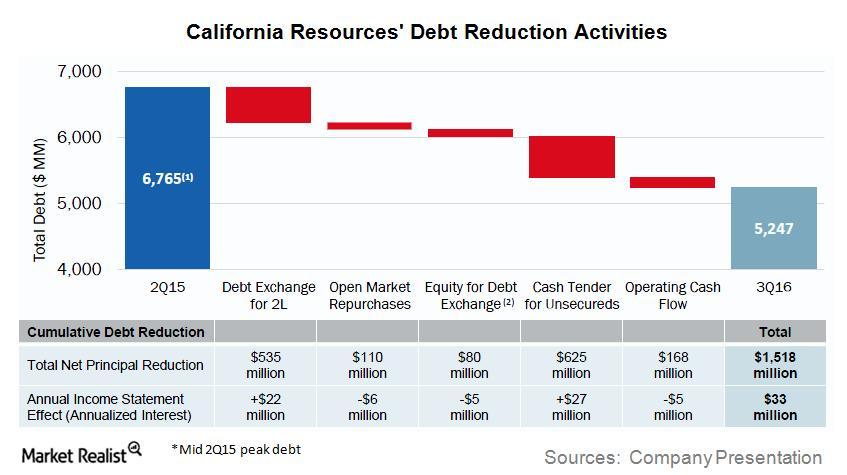
California Resources Has Taken These Steps to Reduce Its Debt
On September 30, 2016, California Resources’ (CRC) total debt stood at ~$5.3 billion. California Resources has been intently focusing on reducing its debt load.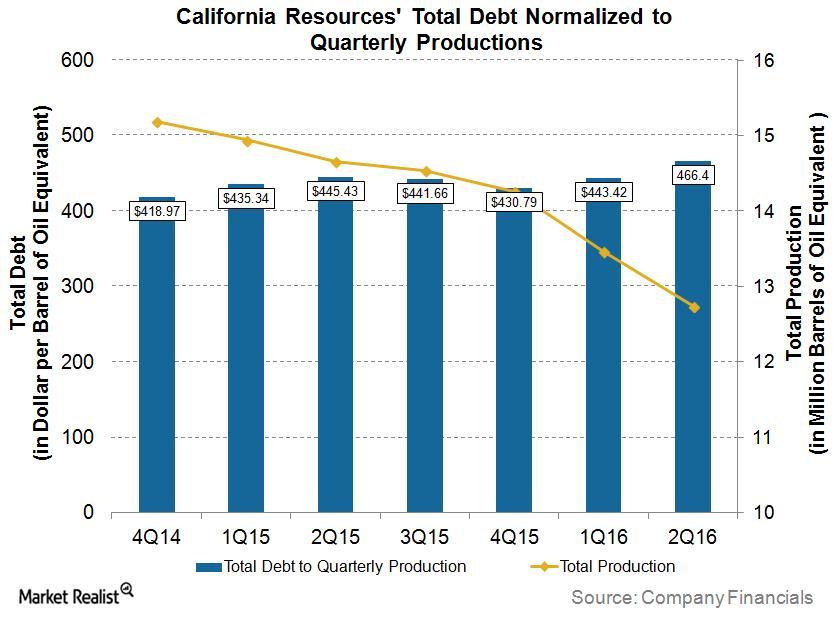
California Resources’ Debt and Production: Chart in Focus
For 2Q16, California Resources (MRO) reported total debt of ~$466 per boe (barrel of oil equivalent) of production.