What’s the Forecast for ExxonMobil’s Stock Price?
Implied volatility in ExxonMobil has fallen from 14.9% on April 3, 2017, to 13.6% to date.
July 26 2017, Updated 7:40 a.m. ET

ExxonMobil’s earnings
In this pre-earnings series, we have looked at ExxonMobil’s (XOM) earnings estimate, its segmental outlook, stock price performance, and its moving average trend. Now, we’ll look at ExxonMobil’s stock price forecast range based on its implied volatility, until its earnings. ExxonMobil is expected to post its 2Q17 earnings on July 28, 2017.
Implied volatility in ExxonMobil and peers
Implied volatility in ExxonMobil has fallen from 14.9% on April 3, 2017, to 13.6% to date. During the same period, ExxonMobil stock fell 1.4%.
Similarly, implied volatility in Statoil (STO) has fallen by 2.5% over April 3 to 24.9%. Also, implied volatility in PetroChina (PTR) and ENI (E) dropped 3.2% and 2.8%, respectively, in the same period. PTR and E’s implied volatilities currently stand at 17.2% and 18.9%, respectively. PTR and E’s stock prices fell by 13% and 6%, respectively, in the stated period, but STO stock rose 2%.
The SPDR Dow Jones Industrial Average ETF (DIA) and the SPDR S&P 500 ETF (SPY) have seen a fall in their implied volatilities by 2.5% and 2.2%, respectively, since April 3. DIA and SPY’s implied volatilities currently stand at 7.0% and 8.4%, respectively. Since April 3, DIA and SPY witnessed a rise in their values by 5% each.
Expected price range for ExxonMobil stock for eight-day period ending July 28
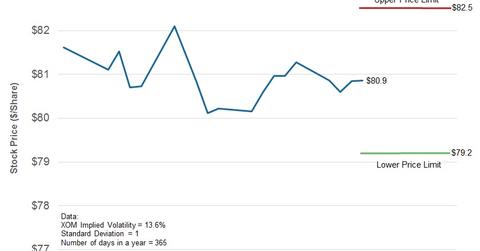
Considering ExxonMobil’s implied volatility of 13.6% and assuming a normal distribution of prices (bell curve model) and a standard deviation of one with a probability of 68.2%, ExxonMobil’s stock price could close between $82.5 and $79.2 per share in the eight calendar days ending July 28.
In the next part, we’ll review where the analyst ratings for ExxonMobil stand pre-earnings.
