Which Gold Miners Could Offer Valuation Upsides after Q2 2018?
The average ratio of the NYSE Arca Gold Miners Index and the S&P 500 Index (SPY) is 0.18 compared to the ten-year average of 0.68.
Dec. 4 2020, Updated 10:52 a.m. ET

Gold miners and broader equities
As we discussed in Gold Stocks Look Cheap Compared to S&P 500—What’s Next? gold miners have started looking inexpensive compared to broader equities.
The average ratio of the NYSE Arca Gold Miners Index and the S&P 500 Index (SPY) is 0.18 compared to the ten-year average of 0.68.
While the valuations of broader equities have continued to increase, the valuations of gold stocks haven’t kept the pace, and the ratio has fallen. In this article, we’ll see how individual gold miners look based on their valuations and compared to their histories and their peers.
Newmont has the highest valuation multiple
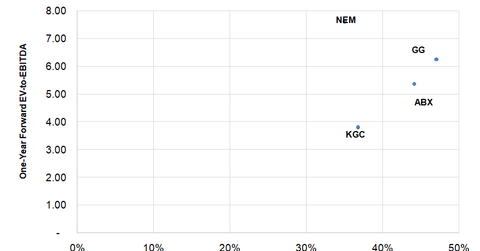
Among the senior mining companies under review (GDX), Newmont Mining (NEM) is currently trading at the highest forward EV-to-EBITDA (enterprise value-to-EBITDA) multiple of 7.6x, implying a premium of 32.0% to the peer average.
Compared to the company’s trailing-five-year average, the multiple implies a discount of 9.0%. The fall in precious metals prices since the start of the year has depressed the multiples of most gold miners. NEM’s forward multiple has fallen 12.0% in 2018. It also has one of the strongest project pipelines in the industry with very low execution risk. This position commands a premium at a time when growth is difficult to come by in the gold mining space. Most of NEM’s assets are in geographically attractive mining jurisdictions.
Goldcorp’s valuation catalysts
Goldcorp (GG) has the second-highest multiple of 6.3x, a premium of 8% to the peer average. Its historical premium has fallen, however. It’s trading at a discount of 30% to its trailing-five-year average multiple.
Goldcorp’s production, costs, and reserves are expected to improve significantly backed by a solid project pipeline, which is progressing on schedule and on budget. Its balance sheet is also in deleveraging mode. These factors could help its stock continue to outperform in 2018 and beyond, which could help its valuation multiple rerate higher.
Barrick Gold
Barrick Gold (ABX) is trading at a forward multiple of 5.3x, reflecting a discount of 7% to the peer average and 18% to its trailing-five-year average. Its higher financial leverage is still a concern for investors. The recent issues at its Tanzanian mines have added to the pressure. Its production growth pipeline is also less than robust, triggering a discount.
Kinross Gold
Kinross Gold (KGC) has the lowest forward multiple of 3.8x, implying a discount of 35% to the peer average. Though its discount started to fall as it addressed production growth concerns, geopolitical concerns have weighed down the stock and its multiple in 2018. Moreover, if the recent Tasiast Expansion Phase Two issue is not resolved as soon as possible, the company could see further downside.
