What’s the Forecast for Southwestern Energy Stock?
As of July 25, Southwestern Energy (SWN) had an implied volatility of ~50.0%, which is lower when compared with its implied volatility of ~50.9% at the end of the second quarter of 2018.
Aug. 1 2018, Updated 10:30 a.m. ET

Southwestern Energy’s implied volatility
As of July 25, Southwestern Energy (SWN) had an implied volatility of ~50.0%, which is lower when compared with its implied volatility of ~50.9% at the end of the second quarter of 2018.
SWN’s price range forecast
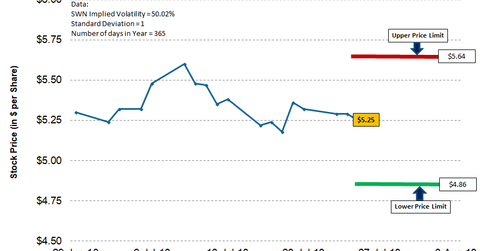
Southwestern Energy is expected to report its Q2 2018 earnings on August 2 after the market closes. Based on Southwestern Energy’s implied volatility of ~50.0%, assuming a normal distribution of prices, 365 days in a year, and a standard deviation of one, its stock could close between $5.64 and $4.86 by August 2. SWN’s stock could stay in this range 68% of the time. On July 25, SWN’s stock price closed at $5.25.
Peer price range forecasts
As of July 25, SWN’s peer Range Resources (RRC) had an implied volatility of ~44.5%, which means RRC stock is expected to close between $16.78 and $15.02 by August 2. On July 25, RRC’s stock price closed at $15.90. Just like SWN, RRC has operations in the Marcellus Shale.
As of July 25, the First Trust Natural Gas ETF (FCG) had an implied volatility of ~22.5%, which means FCG is expected to close between $24.29 and $22.97 by August 2. On July 25, FCG’s price closed at $23.63. FCG represents an index of energy stocks that derive a substantial portion of their revenues from the exploration and production of natural gas.
On July 25, SWN’s peers California Resources (CRC) and Devon Energy (DVN) had implied volatilities of ~89.7% and ~37.8%, respectively. By August 2, these stocks are expected to close in a range of $44.53—$33.53 and $47.64—$42.90, respectively.
Based on the inputs used in the calculation of price range, there is a 68% probability that these stocks will close in their range for the given period.
