What Does Valero’s Moving Average Suggest?
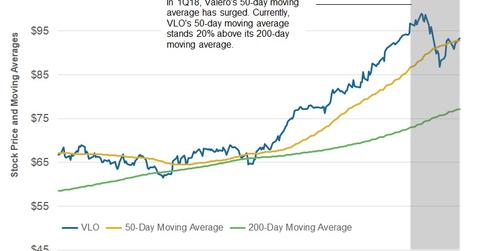
In 1Q18, VLO’s 50-day moving average remained above its 200-day moving average.
March 5 2018, Updated 5:55 p.m. ET

Valero’s moving averages in the past four quarters
In 1Q17, VLO’s 50-day moving average stood above its 200-day moving average. This occurred despite the fall in stock prices led by dismal 4Q16 earnings and a surge in gasoline and distillate inventories in the industry.
In 2Q17, Valero announced better-than-expected 1Q17 earnings, keeping its 50-day moving average above its 200-day moving average. In 3Q17, Valero’s refining margin indicators rose quarter-over-quarter and year-over-year, mainly due to the impact of Hurricane Harvey. Plus, the stock trended higher in 4Q17, possibly due to US tax reforms. VLO’s 50-day moving average surged.
Valero’s moving averages in 1Q18
In 1Q18, VLO’s 50-day moving average remained above its 200-day moving average. Valero’s 4Q17 earnings exceeded estimates, and company posted a strong set of numbers.
Currently, VLO’s 50-day moving average stands 20.0% above its 200-day moving average. This represents a wide gap between VLO’s 50-day and 200-day moving averages.
So, the apprehension that Valero’s stock price fall could cause its 50-day moving average to break below its 200-day moving average is minimal. This implies that Valero still stands in technically bullish terrain.
Peers’ moving averages
Among Valero’s peers, HollyFrontier (HFC) and PBF Energy’s (PBF) 50-day moving averages stand 33.0% and 22.0%, respectively, above their 200-day moving averages. Phillips 66’s (PSX) 50-day moving average stands 11.0% above its 200-day moving average. Delek US Holdings (DK) 50-day moving average stands 22.0% above its 200-day moving average.
The SPDR Dow Jones Industrial Average ETF’s (DIA) 50-day moving average is 10.0% above its 200-day moving average.
Move on to the next part to look at Valero’s quarter-end price range forecast based on its implied volatility.
