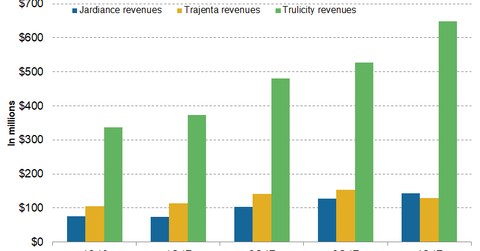
Eli Lilly’s Jardiance, Trajenta, and Trulicity in 2017
In 4Q17, Eli Lilly’s (LLY) Jardiance generated revenues of $143.2 million compared to $76.1 million in 4Q16.
March 15 2018, Published 3:31 p.m. ET

Jardiance’s revenue trends
In 4Q17, Eli Lilly’s (LLY) Jardiance generated revenues of $143.2 million compared to $76.1 million in 4Q16, which reflected an ~88% growth on a YoY (year-over-year) basis and a ~13% growth on a quarter-over-quarter basis.
In 4Q17, in the US market and international markets, Jardiance reported revenues of $92.1 million and $51.1 million, respectively, compared to $55.8 million and $20.4 million, respectively, in 4Q16.
In fiscal 2017, Jardiance generated revenues of $447.5 million compared to $201.9 in 2016. In 2017, in the US market and international markets, Jardiance reported revenues of $290.4 million and $157.0 million, respectively, compared to $144.5 million and $57.4 million, respectively, in 2016.
In the SGLT2 (sodium-glucose cotransporter 2) class of anti-diabetic drugs, Jardiance competes with AstraZeneca’s (AZN) Farxiga and Johnson & Johnson’s (JNJ) Invokana.
Trajenta’s revenue trends
In 4Q17, Trajenta generated revenues of $129.7 million, which is a ~23% growth on a YoY basis and a 15% decline on a quarter-over-quarter basis.
In 4Q17, in the US market and international markets, Trajenta reported revenues of $39 million and $90.7 million, respectively, compared to $31 million and $74.8 million, respectively, in 4Q16.
In fiscal 2017, Trajenta generated revenues of $537.9 million compared to $436.6 million in 2016. In 2017, in the US market and international markets, Trajenta reported revenues of $213.2 million and $324.7 million, respectively, compared to $165.9 million and $270.7 million, respectively, in 2016.
In the DPP-4 (dipeptidyl peptidase 4) class of drugs, Trajenta’s peers include Merck & Co.’s (MRK) Januvia, Novartis’s (NVS) Galvus, and AstraZeneca’s Onglyza.
Trulicity’s revenue trends
In 4Q17, Trulicity reported revenues of $649 million compared to $337 million in 4Q16, which reflected a ~93% growth on a YoY basis and a ~23% growth quarter-over-quarter.
In 4Q17, in the US market and international markets, Trulicity reported revenues of $519.8 million and $129.2 million, respectively, compared to $268.1 million and $69 million, respectively, in 4Q16.
In fiscal 2017, Trulicity generated revenues of $2 billion. In the US market and international markets, Trulicity reported revenues of $1.6 billion and $419.9 million, respectively, compared to $737.6 million and $187.9 million, respectively, in 2016.
The increasing market share of Trulicity in the GLP-1 (glucagon-like peptide 1) class of drugs primarily attributed to revenue growth. In the marketplace, Trulicity’s peers include Novo Nordisk’s (NVO) Victoza and AstraZeneca’s (AZN) Byetta.
