Mylan’s Valuation in January 2018
Mylan (MYL) is a leading pharmaceutical company with over 1,400 generic and specialty pharmaceutical products in its portfolio.
Jan. 10 2018, Published 12:03 p.m. ET

A look at Mylan’s valuation
Mylan (MYL) is a leading pharmaceutical company with over 1,400 generic and specialty pharmaceutical products in its portfolio.
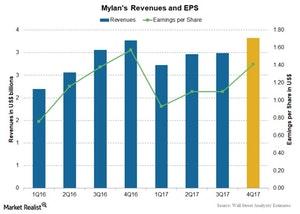
The above chart compares revenues and earnings-per-share (or EPS) for Mylan over the last few quarters and estimates for 4Q17. For 3Q17, Mylan reported EPS of $1.10 on revenues of $2.99 billion, reporting a 2.3% decline in revenues, compared to $3.06 billion in 3Q16. Further, Wall Street analysts estimate EPS of $1.41 on revenues of $3.32 billion in 4Q17—which would be 1.6% growth in revenues from 4Q16. For 2017, analysts estimate EPS of $4.54 on revenues of $11.99 billion, 8.2% growth from revenues of $11.08 billion in 2016.
Forward PE
As of January 10, Mylan (MYL) was trading at a forward PE multiple of ~8.3x, compared to the industry average of 18.1x. Competitors AstraZeneca (AZN) and Perrigo (PRGO) are trading at a higher forward PE multiple of 21.7x and 16.7x respectively, while Teva Pharmaceuticals (TEVA) is trading at a lower forward PE multiple of 6.5x.
Forward EV/EBITDA
On a capital structure–neutral and excess cash–adjusted basis, Mylan was trading at a forward EV/EBITDA (enterprise value to earnings before interest, tax, depreciation, and amortization) multiple of 8.8x, compared to the industry average of ~12.8x, as of January 10. Competitors Teva Pharmaceuticals (TEVA), AstraZeneca (AZN), and Perrigo (PRGO) are trading at forward EV/EBITDA multiples of 11.0x, 15.4x, and 12.9x, respectively.
The VanEck Vectors Pharmaceutical ETF (PPH) invests 5.0% of its portfolio in Mylan (MYL), 5.5% in Teva Pharmaceuticals (TEVA), 5.1% in AstraZeneca (AZN), and 4.5% in Perrigo (PRGO).
