How Coty’s Performance Affected Its Outlook
Coty (COTY) net revenue fell 1% in 2016 before climbing 76% in 2017. The Consumer Beauty segment drove the growth in both years.
Jan. 10 2018, Updated 3:44 p.m. ET

What drove the recovery of Coty’s net revenue?
Coty (COTY) net revenue fell 1% in 2016 before climbing 76% in 2017. The Consumer Beauty segment drove the growth in both years. The Luxury and Professional Beauty segments recorded some declines in 2016 before growing in 2017. Asia, Latin America, the Middle East, Africa, and Australia (or ALMEA) drove the growth in both years. North America and Europe recorded some declines in 2016 before growing in 2017.
Net revenue grew 107% in 1Q18. Every segment and geographic region drove the growth.
What led to the fall in EPS?
Gross profit fell 1% in 2016 before climbing 78% and 115% in 2017 and 1Q18, respectively. Operating expenses increased 5%, 115%, and 127% in 2016, 2017, and 1Q18, respectively. 2017 saw high selling, general, and administrative (SG&A) expenses, amortization, restructuring, and acquisition-related costs. Operating cost heads remained the same in 1Q18, barring a decrease in acquisition-related expenses. As a result, operating income fell 36%, 272%, and 38% in 2016, 2017, and 1Q18, respectively. Adjusted operating income grew 18%, 24%, and 17% in 2016, 2017, and 1Q18, respectively.
Interest expenses have increased over the years. As a result, adjusted net income gained 27% in 2016 before falling 11% and 3% in 2017 and 1Q18, respectively. Adjusted diluted EPS grew 38% in 2016 before falling 54% and 57% in 2017 and 1Q18, respectively. Share buybacks enhanced the 2016 EPS numbers.
Dividend and price growth
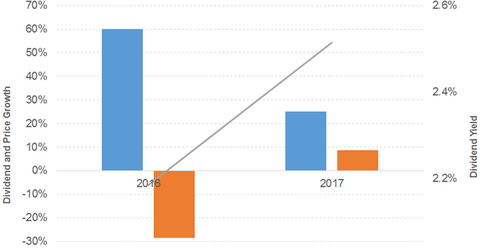
The company’s dividend per share grew 60% and 25% in 2016 and 2017, respectively. Prices fell 29% in 2016 before gaining 9% in 2017, which led to the upward-sloping dividend yield curve. A forward PE (price-to-earnings ratio) of 29.3x and dividend yield of 2.5% compares to a sector average forward PE of 26.8x and a dividend yield of 2.2%.
Compare to the broad indexes
The S&P 500 (SPX-INDEX)(SPY) offers a dividend yield of 2.2%, a PE ratio of 23.4x, and a YTD (year-to-date) return of 19.6%. The Dow Jones Industrial Average (DJIA-INDEX)(DIA) has a dividend yield of 2.2%, a PE ratio of 22.3x, and a YTD return of 25.1%. The NASDAQ Composite (COMP-INDEX)(ONEQ) has a PE ratio of 28.2x and a YTD return of 24.8%.
Net revenue and EPS outlook
Coty is projected to grow its net revenue 19% in 2018. The 2018 diluted EPS is being projected to grow 10%.
