Is Gulfport Energy’s Normalized Free Cash Flow Trending Up?
For 9M17 (the first nine months of 2017), Gulfport Energy (GPOR) had normalized FCF (free cash flow) of -336%, the fourth lowest among the upstream producers we have been tracking.
Dec. 22 2017, Updated 10:32 a.m. ET

Gulfport Energy’s normalized free cash flow in 2017
For 9M17 (the first nine months of 2017), Gulfport Energy (GPOR) had normalized FCF (free cash flow) of -336%, the fourth lowest among the upstream producers we have been tracking. To know more about our normalized free cash flow methodology and filtering criteria, refer to part one of this series. In this part, we’ll study GPOR’s free cash flow and normalized free cash flow trends.
Gulfport Energy’s free cash flow trend
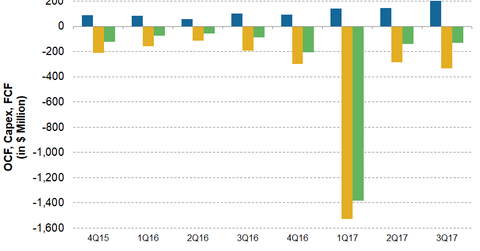
In 3Q17, Gulfport Energy reported negative free cash flow of -$130 million, which is lower when compared with GPOR’s FCF of -$88 million in 3Q16. In the last four quarters, Gulfport Energy’s free cash flow showed a U-shaped trend. In 1Q17, GPOR reported the lowest ever free cash flow of -$1.4 billion, which could be attributed to the higher capex due to the acreage acquisition in SCOOP (South Central Oklahoma Oil Province) for ~$1.9 billion.
Gulfport Energy’s normalized free cash flow trend
In the last one year, Gulfport Energy’s (GPOR) normalized FCF (free cash flow) increased from -86% in 3Q16 to -63% in 3Q17. The increase in GPOR’s normalized FCF in the last four quarters can be attributed to the higher increase in its OCF (operating cash flow) compared to the increase in capital expenditures in the last four quarters. In the last four quarters, GPOR’s OCF increased by ~100%, whereas its capital expenditures increased less by ~76%.
Gulfport Energy’s stock performance in 2017
Year-to-date in 2017, GPOR’s stock is down by ~44.6%. In comparison, the First Trust Natural Gas ETF (FCG), which contains upstream companies that are primarily natural gas producers, decreased by ~15.4%, whereas the SPDR Dow Jones Industrial Average ETF (DIA) increased by ~27.9%.
Next, we’ll take a look at WPX Energy’s (WPX) free cash flow trends.
