Assessing the Risk of a Flattening Yield Curve
St. Louis Fed president and CEO James Bullard gave a presentation at a regional economic briefing on December 1. Throughout this series, we’ll analyze Bullard’s take on the risks of an inverted yield curve.
Dec. 8 2017, Published 4:31 p.m. ET

St. Louis Fed’s James Bullard
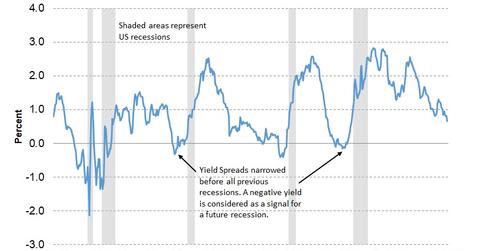
St. Louis Fed president and CEO James Bullard gave a presentation at a regional economic briefing on December 1. In the presentation, “Assessing the Risk of Yield Curve Inversion,” Bullard said that yield curve inversion deserves the attention of both markets and policymakers. He highlighted the reasons for the possibility of a yield curve inversion in the future and gave suggestions on how to avoid it. Yield curve inversion is considered a warning of recession.
Understanding yield curves
The chart above shows the spread between ten-year and two-year Treasuries (BND). According to Investopedia, “A yield curve is a line that plots the interest rates, at a set point in time, of bonds having equal credit quality but differing maturity dates.” The yield curve that investors usually refer to is the US Treasury (GOVT) yield curve, which plots Fed funds and 30-year US Treasuries. Yield curves are usually upward sloping, as investors require interest that increases the longer they hold an investment. The current two-year (SHY) yield is 1.8%, the ten-year yield is 2.4%, and the 30-year (TLT) yield is 2.8%.
When does a yield curve invert?
Whereas a normal yield curve is upward sloping, curves can be inverted when short-term yields are higher than longer-term yields, meaning investors get paid less for holding an investment for a longer term than a shorter term. We’ll discuss factors impacting yield curves (AGG) in the next part of this series. Throughout this series, we’ll analyze Bullard’s presentation on the risks of an inverted yield curve.
