The Leading Credit Index: October Update
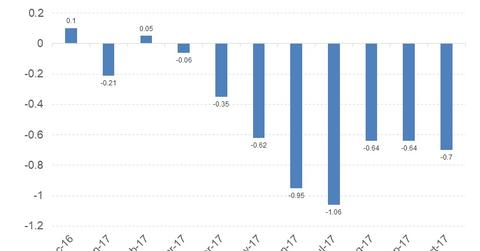
The Leading Credit Index for October was reported to be -0.70, improving from the revised September reading of -0.64.
Dec. 1 2017, Updated 7:31 a.m. ET

Understanding the Leading Credit Index
The Leading Credit Index (or LCI) is an interesting index published by the Conference Board every month along with the Leading Economic Index (or LEI). The LCI is based on an economic model that tracks the changes of six financial market instruments. All six components of this index track the lending conditions in the US economy.
The six constituents of this index are:
- the two-year swap (SHY) spread (real time)
- the LIBOR three-month (SCHO) less three-month Treasury bill (VGSH) yield spread (real time)
- debit balances at margin account at broker-dealer (monthly)
- AAII Investors Sentiment Bullish (%) less Bearish (%) (weekly)
- Senior Loan Officers C&I loan survey: bank tightening credit to large (SPY) and medium firms (IWM) (quarterly)
- security repurchases (GOVT) (quarterly) from the Total Finance-Liabilities section of the Federal Reserve’s flow of funds report
These are forward-looking indicators and form a part of this Leading Economic Index.
Performance of the LCI in October
The Leading Credit Index for October was reported to be -0.70, improving from the revised September reading of -0.64. The LCI is an inverse index, meaning a negative value is considered to have a positive impact on the economy, and on the LEI.
This forward-looking credit index has a weight of ~8.2% of the LEI. In the November LEI report, the LCI had a net positive impact of 6.0%.
No red flags from LCI in October
A healthy credit climate is crucial to economic progress in any country. Companies take on credit to invest and improve economic output. The LCI improved marginally in October and at its current level, it doesn’t raise any red flags about credit conditions.
In the next part of this series, we’ll discuss the rising worries of narrowing credit spreads and an inverting yield curve.
