Where Natural Gas Prices Could Go Next Week
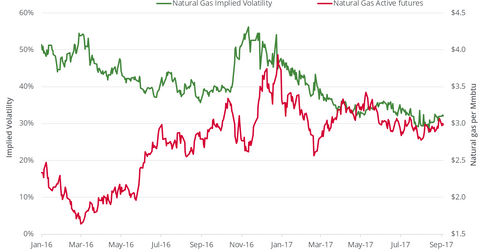
On September 21, 2017, natural gas implied volatility was 35.1%, or 5.1% above the 15-day average.
Nov. 20 2020, Updated 4:43 p.m. ET

Natural gas implied volatility
On September 21, 2017, natural gas’s implied volatility was 35.1%, or 5.1% above the 15-day average.
Usually, natural gas (UNG) (BOIL) prices and implied volatility move inversely. For example, on March 3, 2016, implied volatility in natural gas rose to 53.8%, and on that day, natural gas active futures settled at a 17-year low.
Since then, its implied volatility has fallen 34.8%, while natural gas futures have risen 79.7%. In the trailing week, its implied volatility rose 1.4%, while natural gas prices fell 4%.
Price forecast
There’s a 68% chance that natural gas active futures could close between $2.81 and $3.09 per MMBtu (million British thermal units) in the next seven days. This calculation is based on the assumption that prices are normally distributed, using a standard deviation of one and an implied volatility of 35.1%.
On September 21, 2017, natural gas (UNG) October futures closed at $2.95 per MMBtu (million British thermal units). There’s a bigger range toward the downside, and given recent bearish momentum, a close below $3 is more likely.
If natural gas prices remain below the $3 mark, then it could be a bearish catalyst for ETFs like the First Trust ISE-Revere Natural Gas ETF (FCG), the Direxion Daily Natural Gas Related Bear 3X ETF (GASX), and the Direxion Daily Natural Gas Related Bull 3X ETF (GASL).
For more analysis of natural gas prices, check out Market Realist’s series Are Natural Gas Prices Set to Rally?
