Could the Oil Rig Count Threaten Bullish Bets on Oil Prices?
The US oil rig count rose by three to 768 for the week ended August 11, 2017.
Aug. 16 2017, Published 5:39 p.m. ET

Oil rigs
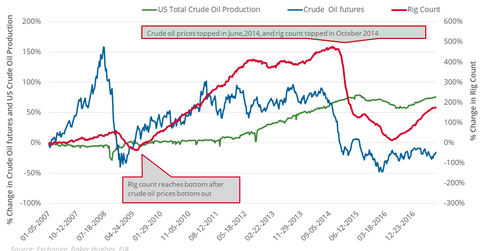
The US oil rig count rose by three to 768 for the week ended August 11, 2017. On a year-over-year basis, the US oil rig count has risen 1.9x. However, US crude oil active futures rose only 4%.
US crude oil production
For the week ended August 4, 2017, US crude oil production fell 1.9% from its record-high 9.6 million barrels per day in the week ended June 5, 2015. US crude oil (DBO) (OIIL) (USO) active futures have been down 55.7% from their pre-crisis high in June 2014.
Since June 2014, the US crude oil rig count has fallen 50.3%. The large fall in oil prices forced US crude oil producers (IEO) to reduce their oil output.
An important pattern to watch
Crude oil futures’ lows and highs occurred in a gap of three to six months following the US oil rig count. For example, in December 2008, US crude oil active futures settled at their multiyear low. In just six months, the US oil rig count also fell to its multiyear low.
WTI crude oil prices settled at their 12-year low on February 11, 2016. In the week ended May 27, 2016, the US oil rig count bottomed out. Between February 11, 2016, and August 15, 2017, US crude oil active futures rose 81.4%.
The US oil rig count has more than doubled since the low of 316 in the week ended May 27, 2016. Between May 27, 2016, and August 4, 2017, the rise in the US oil rig count has increased US crude oil production by 7.9%.
Apart from the rise in the US oil rig count, new-well oil production per rig could rise 11.6% in September 2017 on a year-over-year basis—another bearish factor for oil prices. Energy ETFs such as the Fidelity MSCI Energy ETF (FENY) and the Energy Select Sector SPDR ETF (XLE) could take important cues from the above development.
