Unpacking the Technical Indicators for Mining Stocks
Mining stocks have bounced back from the choppy markets we’ve seen over the past month. On July 20, most mining stocks saw upward movements in their prices.
July 24 2017, Published 4:42 p.m. ET

Miners regain
Mining stocks have bounced back from the choppy markets we’ve seen over the past month. On July 20, most mining stocks saw upward movements in their prices. It’s important for investors to read crucial parameters such as volatility and the relative strength index (or RSI) in order to make investment decisions.
In this part of our series, we’ll look at some important technical indicators for Agnico-Eagle Mines (AEM), Primero Mining (PPP), Silver Wheaton (SLW), and Pan American Silver (PAAS).
Implied volatility
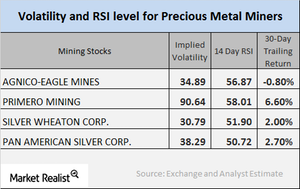
Call-implied volatility measures fluctuations in the price of an asset and fluctuations in the price of its call option. On July 20, 2017, Agnico, Primero, Silver Wheaton, and Pan American had implied volatilities of 34.9%, 90.6%, 30.8%, and 38.3%, respectively. Volatility in mining stocks is often greater than precious metals’ volatility.
RSI
The relative strength index or RSI analyzes whether an asset is overbought or oversold. If an RSI level is above 70, the asset may see a decline in price because it’s overbought. If an RSI level is below 30, the asset may be oversold, and chances are that the price could rise soon.
Lately, the RSI levels for these four miners have rebounded. Agnico, Primero, Silver Wheaton, and Pan American have marginal RSI levels of 56.9, 58, 51.9, and 50.7, respectively.
Leveraged gold and silver funds like the Direxion Daily Junior Gold Miners ETF (JNUG) and the ProShares Ultra Silver ETF (AGQ) are also influenced by fluctuations in precious metal prices. These two funds rose 10.1% and 7.5%, respectively, on a five-day-trailing basis due to miners’ ongoing rebound.
