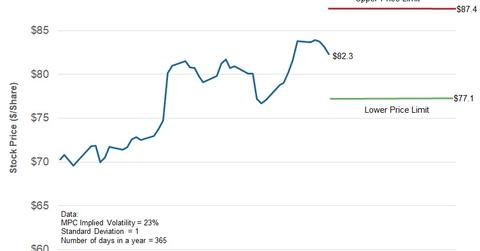
Marathon Petroleum Stock: Price Range until September 28
The implied volatility in Marathon Petroleum has fallen by eight percentage points since July 2 to the current level of 23%.
Sept. 5 2018, Updated 12:30 p.m. ET

Expected price range for Marathon Petroleum stock
In the previous part, we discussed the trend in Marathon Petroleum’s (MPC) moving averages. Now, we’ll discuss the company’s implied volatility in order to forecast its stock price range until September 28.
The implied volatility in Marathon Petroleum has fallen by eight percentage points since July 2 to the current level of 23%. During the same period, Marathon Petroleum stock has risen 17%. So, there appears to be a general inverse relationship between the implied volatility and the stock price.
Considering Marathon Petroleum’s implied volatility of 23% and assuming a normal distribution of prices (bell curve model) and standard deviation of one (with a probability of 68.2%), Marathon Petroleum’s stock price could close between $87.4 per share and $77.1 per share for the 28-day period ending on September 28. Currently, the stock trades at $82.3 per share.
Peers’ implied volatilities
Valero Energy (VLO), Phillips 66 (PSX), and Delek US Holdings’ (DK) implied volatilities have fallen by ten percentage points, seven percentage points, and eight percentage points, respectively, since July 2. Valero Energy, Phillips 66, and Delek US Holdings’ stock prices have risen 8%, 7%, and 10%, respectively, during the same period. The implied volatilities and stock prices moved inversely. Currently, the implied volatilities in Valero Energy, Phillips 66, and Delek US Holdings are 20%, 17%, and 36%, respectively.
A similar trend is visible between the implied volatilities and the values of the SPDR Dow Jones Industrial Average ETF (DIA) and the SPDR S&P 500 ETF’s (SPY), which closely resemble the Dow Jones Industrial Average (DIA) and the S&P 500 Index (SPY), respectively.
The implied volatilities in the Dow Jones Industrial Average and the S&P 500 Index have fallen by three percentage points and two percentage points since July 2 to the current levels of 10% and 8%, respectively. During the same period, their values each rose 7%.
