Could Alaska Air Group’s Margin Expand in 2017?
In 1Q17, Alaska Air Group’s (ALK) EBITDA (earnings before interest, tax, depreciation, and amortization) is expected to fall 5.8% to $385 million.
Aug. 18 2020, Updated 5:30 a.m. ET

Analyst estimates
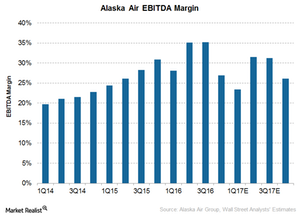
In 1Q17, Alaska Air Group’s (ALK) EBITDA (earnings before interest, tax, depreciation, and amortization) is expected to fall 5.8% to $385 million, mainly due to its EBITDA margin’s contracting to 21.6% in 1Q17 from 30.4% in 1Q16.
In 2Q17, ALK’s EBITDA is expected to rise 18.9% to $641.8 million year-over-year (or YoY) with an EBITDA margin of 30.7%. In 3Q17, its EBITDA is expected to rise 23.5% YoY to $680.7 million with an EBITDA margin of 30.6%.
Investors should note that ALK’s EBITDA margin is expected to contract in both the second and third quarters of 2017.
In 2Q16, Alaska’s EBITDA margin was 36.1%, and in 3Q16, it was 35.2%. Thus, most of its growth will be coming from revenue growth. In 4Q17, ALK’s EBITDA is expected to rise 33% YoY to $532.4 with an EBITDA margin of 26%.
Alaska Air is expected to record 2017 EBITDA growth of 21% to $2.2 billion. It’s expected to clock an EBITDA margin of 27%, similar to the margin of 30.6% it clocked in 2016. Most of this growth will mainly be due to the company’s Virgin America acquisition. Its organic EBITDA growth is actually expected to slow given the contraction in its EBITDA margin to 27.9%.
Cost to rise
For 1Q17, Alaska expects its cost per available seat mile, excluding fuel, to rise ~1% to $0.84–$0.85. The company’s fuel cost per gallon for the quarter is also expected to rise 29.5% to $1.79, compared to $1.38 in 1Q16. For 2017, the company’s cost per available seat mile, excluding fuel, is expected to remain constant.
Investors should consider airlines’ 2016 utilizations and analysts’ estimates for their margins. Investors can gain exposure to airlines through the iShares Transportation Average ETF (IYT). IYT holds 5.4% in Alaska Air, 4.7% in United Continental (UAL), 4.3% in Delta Air Lines (DAL), 3.9% in Southwest Airlines (LUV), 3.6% in American Airlines (AAL), and 1.9% in JetBlue Airways (JBLU).
