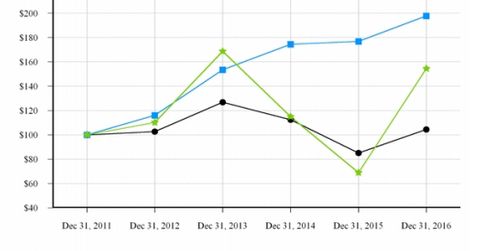
How Has CLR Performed Compared to S&P 500 and Dow Jones?
Let’s take a look at Continental Resources’ (CLR) stock performance in comparison to the performances of the S&P 500 Index and the Dow Jones Oil & Gas Index since 2011.
March 30 2017, Updated 10:36 a.m. ET

Stock performances: CLR versus S&P 500 and Dow Jones
Let’s take a look at Continental Resources’ (CLR) stock performance in comparison to the performances of the S&P 500 Index and the Dow Jones Oil & Gas Index since 2011.
As we can see in the image above, Continental’s stock was on a bullish trend until 2013, outperforming the S&P 500 Index and the Dow Jones US Oil & Gas Index. However, CLR has fallen from those highs. Currently, its stock is underperforming the S&P 500, which represents the broader market, but it’s outperforming the Dow Jones, which represents the broader energy sector.
Year-over-year, CLR has risen 46%, while its peers Cimarex Energy (XEC), Concho Resources (CXO), and Hess (HES) have risen 22%, 21%, and –11.5%, respectively. These companies make up a combined 8.3% of the SPDR S&P Oil & Gas Exploration & Production ETF (XOP).
