How Cabot Oil and Gas’s Relative Valuation Compares to Peers
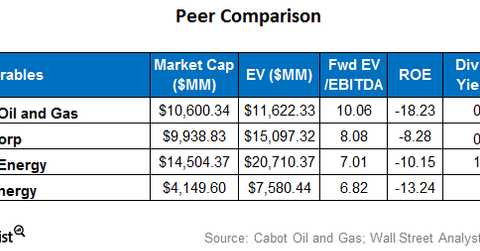
A peer group comparison shows that Cabot’s forward EV-to-EBITDA multiple of ~10.1x is higher than that of its peers.
March 17 2017, Updated 9:06 a.m. ET

Cabot’s relative valuation
In the previous part of this series, we compared Cabot Oil and Gas’s (COG) EV-to-EBITDA (enterprise value to earnings before interest, tax, depreciation, and amortization) multiple against its own historical levels. In this part, we’ll look at the company’s valuation against the multiples of its peers.
Cabot’s forward EV to EBITDA
A peer group comparison shows that Cabot’s forward EV-to-EBITDA multiple of ~10.1x is higher than that of its peers. EQT (EQT) is currently trading at a forward EV-to-EBITDA multiple of ~8.1x. Noble Energy (NBL) is trading at a multiple of ~7x. Rice Energy (RICE) is trading at a slightly lower EV-to-EBITDA multiple of ~6.8x. So, COG appears to be overvalued compared to its peers. Together, these companies make up ~7.7% of the SPDR S&P Oil & Gas Exploration & Production ETF (XOP).
Cabot’s returns and dividends
In terms of returns, COG offers worse returns when its profitability is scaled by its shareholder equity. This calculation is called ROE (return on equity). COG’s ROE stands at -18%, which comes as a result of the company’s negative net earnings, or net loss. However, on an adjusted basis, COG reported a net income of $5.1 million in 4Q16. Read more about COG’s 4Q16 earnings in Cabot’s 4Q16 Earnings and Revenue Rose but Missed Estimates.
Among the company’s peers, EQT has the best ROE at about -8.1%. In terms of more direct returns to shareholders, COG offers a dividend yield (dividends divided by share price) of ~0.36%. Noble Energy has the highest dividend yield of ~1.2%.
