Understanding Marathon Oil’s EBITDA Normalized to Production
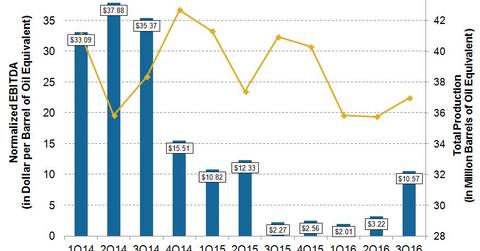
In 3Q16, Marathon Oil (MRO) reported normalized EBITDA per unit of production of ~$10.57 per boe, which was ~366% higher than in 3Q15.
Feb. 1 2017, Updated 9:07 a.m. ET

Marathon Oil’s EBITDA normalized to production
In 3Q16, Marathon Oil (MRO) reported normalized EBITDA (earnings before interest, tax, depreciation, and amortization) per unit of production of ~$10.57 per boe (barrel of oil equivalent), which was ~366% higher than in 3Q15.
Marathon Oil’s normalized EBITDA per unit of production peaked in 2Q14. In 1Q16, MRO reported its lowest ever normalized EBITDA per unit of production of only ~$2.01 per boe. Sequentially, Marathon Oil’s 3Q16 normalized EBITDA per unit of production was ~228% higher than in 1Q16.
For 3Q16, other upstream companies like Murphy Oil (MUR), California Resources (CRC), and Denbury Resources (DNR) have reported much lower year-over-year normalized EBITDA per unit of production.
Notably, the ETF ISE-Revere Natural Gas Index Fund (FCG) invests in natural gas producers.
