Bank of America/Merrill Lynch Downgrades Kate Spade to ‘Neutral’
Kate Spade (KATE) reported fiscal 3Q16 net sales of $316.5 million—a rise of 14.1% compared to net sales of $277.3 million in fiscal 3Q15.
Nov. 20 2020, Updated 11:41 a.m. ET

Price movement
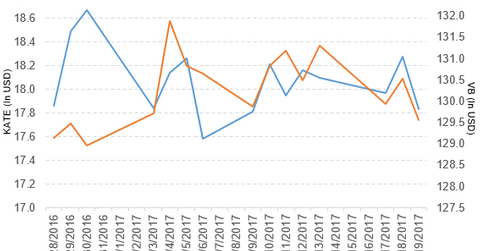
Kate Spade (KATE) has a market cap of $2.3 billion. It fell 2.5% to close at $17.83 per share on January 19, 2017. The stock’s weekly, monthly, and year-to-date (or YTD) price movements were -0.67%, 22.4%, and -4.5%, respectively, on the same day.
KATE is trading 5.0% above its 20-day moving average, 8.9% above its 50-day moving average, and 8.1% below its 200-day moving average.
Related ETF and peers
The Vanguard Small-Cap ETF (VB) invests 0.09% of its holdings in KATE. The YTD price movement of VB was 0.46% on January 19.
The market caps of KATE’s competitors are as follows:
KATE’s rating
On January 19, 2017, Bank of America/Merrill Lynch downgraded Kate Spade & Company’s rating to “neutral” from “buy.”
Performance of Kate Spade in fiscal 3Q16
Kate Spade (KATE) reported fiscal 3Q16 net sales of $316.5 million—a rise of 14.1% compared to net sales of $277.3 million in fiscal 3Q15. The company’s gross margin narrowed 180 basis points and its operating margin rose 730 basis points in fiscal 3Q16 compared to fiscal 3Q15.
Its net income and EPS (earnings per share) rose to $29.6 million and $0.23, respectively, in fiscal 3Q16 compared to $2.3 million and $0.02, respectively, in fiscal 3Q15.
Kate Spade’s cash and cash equivalents and inventories rose 40.2% and 5.7%, respectively, in fiscal 3Q16 compared to fiscal 3Q15. Its current ratio rose to 2.8x and its debt-to-equity ratio fell to 2.0x in fiscal 3Q16 compared to 2.0x and 4.3x, respectively, in fiscal 3Q15.
Projections
Kate Spade made the following projections for fiscal 2016:
- net sales of $1.37 billion–$1.40 billion
- adjusted EBITDA[1. earnings before interest, tax, depreciation, and amortization] of $242 million–$260 million
- EPS of $0.63–$0.70 with the use of a normalized tax rate of 40%
- capital expenditures of $65 million–$70 million
For an ongoing analysis of this sector, please visit Market Realist’s Consumer Discretionary page.
