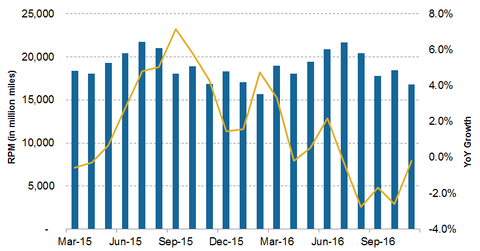
American Airlines’s Traffic Growth Lags Capacity Growth
In November 2016, American Airlines’s (AAL) traffic fell 0.2% year-over-year, slightly lagging its capacity growth in the same period. Year-to-date, AAL’s traffic has increased 0.3%.
Dec. 21 2016, Updated 4:35 p.m. ET

American Airlines’s traffic growth
In November 2016, American Airlines’s (AAL) traffic fell 0.2% year-over-year (or YoY), slightly lagging its capacity growth in the same period. Year-to-date (or YTD), AAL’s traffic has increased 0.3%.
However, through most of 2016, American Airlines’s traffic growth has lagged its capacity growth. This is in contrast to the airline’s trend in 2015. Throughout most of 2015, American Airlines’s traffic growth exceeded or matched its capacity growth. Airline traffic is measured by revenue passenger miles (or RPM). RPM is the number of revenue passengers multiplied by the total distance traveled.
Domestic markets
American Airlines’s (AAL) domestic traffic fell 1.8% in November 2016. This is in contrast to its peers Alaska Air Group (ALK) and Delta Air Lines (DAL), which witnessed strong growth in their domestic markets. United Continental’s (UAL) domestic traffic was flat during this period. Year-to-date, American Airlines’s domestic traffic has decreased 0.3%.
AAL forms ~2.7% of the PowerShares Dynamic Market Portfolio ETF (PWC).
Pacific traffic drives international markets
Like United Continental (UAL), whose international traffic growth was seen mostly in Pacific markets, American Airlines’s (AAL) international traffic growth also came from the Pacific region. Delta Air Lines’s (DAL) traffic growth was seen mostly in Latin America.
For November 2016, international traffic rose 0.8% YoY. Pacific traffic grew 36.6% YoY, which partially offset the 8.8% and 4.5% decline in Atlantic and Latin American traffic, respectively, in the same period.
Investors can gain exposure to American Airlines by investing in the PowerShares Dynamic Large-Cap Value Portfolio ETF (PWV), which invests 1.4% of its portfolio in AAL.
In the next part, we’ll discuss how these supply and demand factors have affected American Airlines’s unit revenues.
