Nu Skin Enterprises Declares Its 3Q16 Results and Quarterly Dividend
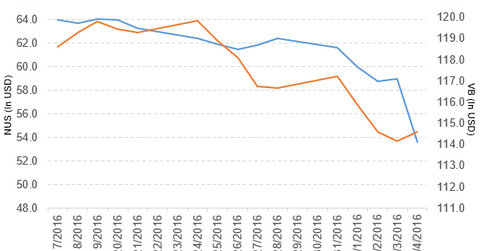
Nu Skin Enterprises (NUS) has a market cap of $3.0 billion. It fell by 9.1% to close at $53.61 per share on November 4, 2016.
Nov. 9 2016, Updated 10:05 a.m. ET

Price movement
Nu Skin Enterprises (NUS) has a market cap of $3.0 billion. It fell 9.1% to close at $53.61 per share on November 4, 2016. The stock’s weekly, monthly, and year-to-date (or YTD) price movements were -14.1%, -18.1%, and 45.4%, respectively, on the same day.
NUS is trading 14.7% below its 20-day moving average, 13.1% below its 50-day moving average, and 16.4% above its 200-day moving average.
Related ETF and peers
The Vanguard Small-Cap ETF (VB) invests 0.09% of its holdings in NUS. The ETF tracks the CRSP US Small Cap Index. The market cap–weighted index includes the bottom 2%–15% of the investable universe. The YTD price movement of VB was 4.6% on November 4.
The market caps of NUS’s competitors are as follows:
Performance of Nu Skin Enterprises in 3Q16
Nu Skin Enterprises (NUS) reported 3Q16 revenue of $604.2 million, a rise of 5.8% compared to revenue of $571.3 million in 3Q15. Sales of Greater China, North Asia, the Americas, and EMEA (Europe, Middle East, and Africa) rose 14.7%, 24.4%, 0.71%, and 4.5%, respectively. Sales of South Asia–Pacific fell 34.9% in 3Q16 compared to 3Q15.
The company’s gross profit margin and operating margin rose 590 basis points and 620 basis points, respectively, in 3Q16 compared to 2Q16. The change in gross margin and operating margin resulted from the impact of China’s inventory charge.
Nu Skin Enterprises’s net income and EPS (earnings per share) rose to $56.9 million and $0.98, respectively, in 3Q16 compared to $16.3 million and $0.28, respectively, in 3Q15.
NUS’s cash and cash equivalents rose 78.6%, and its inventories fell 4.5% in 3Q16 compared to 4Q15. Its current ratio and debt-to-equity ratio rose to 2.2x and 1.1x, respectively, in 3Q16 compared to 1.7x and 0.82x, respectively, in 4Q15.
NUS declared dividend
Nu Skin Enterprises has declared a quarterly dividend of $0.355 per share on its common stock. The dividend will be paid on December 7, 2016, to shareholders of record on November 18, 2016.
Projections
Nu Skin Enterprises (NUS) has made the following projections:
- revenue in the range of $550 million–$570 million for 4Q16, which assumes a negative currency impact of 0%–2%
- EPS in the range of $0.77–$0.81 for 4Q16
- revenue in the range of ~$2.2 billion–$2.3 billion, which includes a negative foreign currency impact of ~2% for fiscal 2016
Next, we’ll discuss Bemis Company (BMS).
