Bank of America/Merrill Lynch Downgrades Greif to ‘Neutral’
Greif reported 3Q16 net sales of $845.0 million, a fall of 9.1% compared to its net sales of $930.0 million in 3Q15.
Nov. 24 2016, Updated 11:04 a.m. ET

Price movement
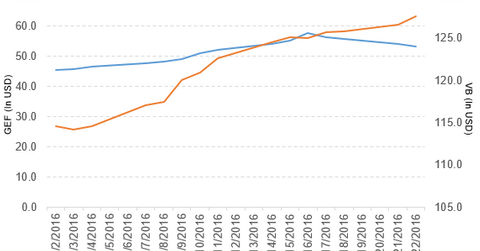
Greif (GEF) has a market cap of $2.8 billion. It fell 1.4% to close at $53.26 per share on November 22, 2016. The stock’s weekly, monthly, and year-to-date (or YTD) price movements were -3.7%, 11.0%, and 79.1%, respectively, on the same day.
GEF is trading 6.5% above its 20-day moving average, 9.1% above its 50-day moving average, and 38.1% above its 200-day moving average.
Related ETF and peers
The Vanguard Small-Cap ETF (VB) invests 0.03% of its holdings in Greif. The YTD price movement of VB was 16.5% on November 22.
The market caps of Greif’s competitors are as follows:
Greif’s rating
On November 22, 2016, Bank of America/Merrill Lynch has downgraded Greif’s rating to “neutral” from “buy.”
Performance of Greif in 3Q16
Greif reported 3Q16 net sales of $845.0 million, a fall of 9.1% compared to its net sales of $930.0 million in 3Q15. Net sales from the company’s Rigid Industrial Packaging & Services, Paper Packaging & Services, and Flexible Products & Services segments fell 10.8%, 2.4%, and 11.7%, respectively, and sales from its Land Management segment rose 13.7% in 3Q16 compared to 3Q15.
The net income and EPS (earnings per share) of Greif’s Class A stock and the EPS of Greif’s Class B stock rose to $46.1 million, $0.78, and $1.18, respectively, in 3Q16, compared to $8.6 million, $0.15, and $0.22, respectively, in 3Q15.
The company reported consolidated EBITDA[1. earnings before interest, tax, depreciation, and amortization] of $101.2 million in 3Q16, a rise of 29.7% compared to 3Q15. GEF’s cash and cash equivalents and inventories fell 11.2% and 2.9%, respectively, in 3Q16, compared to 4Q15.
Projections
Greif made the following projections for 2016:
- Class A EPS before special items in the range of $2.36–$2.56
- capital expenditure in the range of $95 million–$110 million
- free cash flow in the range of $160 million–$190 million
- restructuring expenses in the range of $20 million–$30 million
- tax rate in the range of 35%–38%
Now, let’s take a look at BorgWarner (BWA).
