Silgan Holdings Inc
Latest Silgan Holdings Inc News and Updates
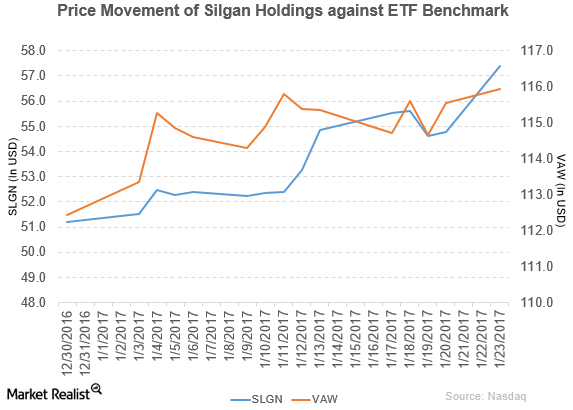
Bank of America/Merrill Lynch Upgrades Silgan Holdings to a ‘Buy’
On January 23, 2017, Bank of America/Merrill Lynch upgraded Silgan Holdings’s (SLGN) rating to a “buy” from “underperform.”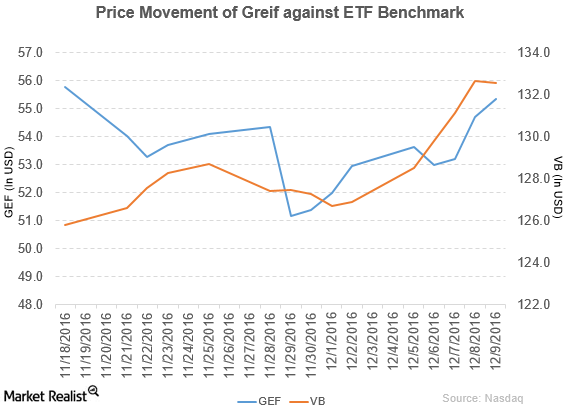
How Did Greif Perform in Fiscal 4Q16?
Greif (GEF) rose 4.6% to close at $55.35 per share during the first week of December 2016.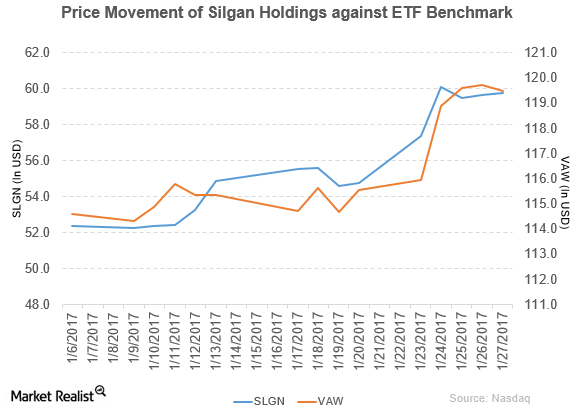
What Moody’s Thinks of Silgan Holdings’ Rating
Silgan Holdings (SLGN) rose 9.1% to close at $59.77 per share during the fourth week of January 2017.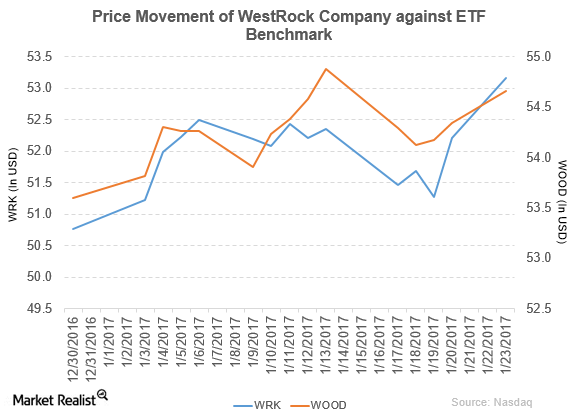
What’s the Latest News on WestRock Company?
WestRock Company (WRK) has a market cap of $13.4 billion. It rose 1.8% to close at $53.16 per share on January 23, 2017.