Cost Curves 101: What Nitrogen Investors Must Consider
Demystifying the cost curve Earlier in this series, we saw that prices of nitrogen have fallen over the years, despite its significance in crop growth and feeding the vast population. The lower prices are due to a flatter cost curve, which we’ll explain in this part. Flat cost curve In the chart above, we compare a […]
Oct. 14 2016, Updated 8:04 a.m. ET

Demystifying the cost curve
Earlier in this series, we saw that prices of nitrogen have fallen over the years, despite its significance in crop growth and feeding the vast population. The lower prices are due to a flatter cost curve, which we’ll explain in this part.
Flat cost curve
In the chart above, we compare a flatter cost curve with a steeper cost curve. As in other commodity businesses, the agricultural chemicals business’s market prices are set by supply and demand.
When the demand (x-axis) increases (moves to the right), the cost per product ton increases. This increase occurs because the producer with a higher cost of production comes online to meet the additional market demand. The producer that comes online, known as the marginal producer, sets the market price (represented by the price ceiling[1.for simplicity, we’ll disregard the price floor]).
However, when the cost of production declines, the cost curve flattens and the marginal producer can produce at a lower cost. The market prices for the commodity fall and squeeze the margins.
Urea cost curve
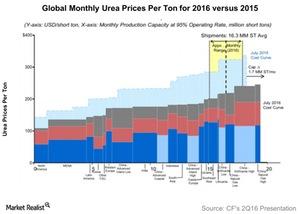
Extending the above cost curve analysis to the current urea cost curve, we see that it has flattened between 2015 and 2016. According to CF, the cost curve has flattened because of low hydrocarbon, gas, and coal prices, low freight rates, and declining currencies. Overall, these factors have impacted fertilizer companies (NANR) such as CF, Mosaic (MOS), Agrium (AGU), and Israel Chemicals (ICL). As a flat cost curve squeezes a company’s margins, we’ll look at CF’s margins in the next part of this series.
