How Has the Volatility of Gold Changed over the Years?
The performance of gold as a contrast to the S&P 500 is reflected during periods of high and low volatility. The S&P 500 has always outperformed gold since April 10, 2013, during periods of both high and low volatility.
Nov. 20 2020, Updated 2:58 p.m. ET

Market Realist – Changing volatility of gold
The performance of gold as a contrast to the S&P 500 is reflected during periods of high and low volatility. The S&P 500 has always outperformed gold since April 10, 2013, during periods of both high and low volatility.
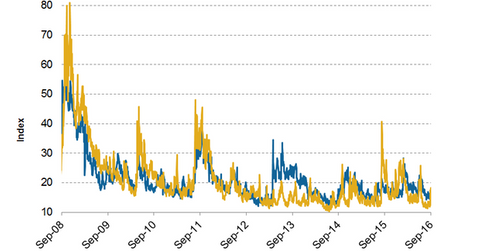
However, gold has been less volatile compared to the S&P 500, as depicted in the graph below. The volatility of gold is measured by the CBOE Gold ETF Volatility Index (GVZ).
We must also realize that volatility, as measured by the CBOE Volatility Index (VIX), has been quite low compared to the period of the global meltdown. The volatility had peaked to the 80 mark in 2008, after penetrating the 20 mark in the second half of 2007. It started cooling down in 2012 and remained in the teens until June 23, 2016.
Volatility shot up 49% to 26 as the S&P 500 lost ~4% on June 24 in the wake of Brexit fears erupting on the market. On the same day, gold prices shot up 4.2% to breach the $1,300 mark and continuing the rally for the first time since 2014. Volatility gradually started falling from June 27, 2016, and has remained in the teens to date.
The Federal Reserve chairperson, Janet Yellen, made optimistic comments on September 2, 2016, which had a positive effect on gold prices. At a Jackson Hole, Wyoming, meeting of principal central bankers, Yellen hinted that a hike in the Fed rate may come sooner rather than later. This resulted from the recovery in the US economy and the labor market. Gold prices increased 1.2% and closed at $1,324.70 on September 2, 2016. The S&P recorded 0.4% growth.
According to the latest World Gold Council report, investors prefer gold investments over the rest due to the negative interest rates associated with the slack monetary policy. This actually drove the gold investment growth 25% in the first half of 2016, which is a 30-year high.
All the central banks—including the ECB, Bank of Japan, and the Bank of England—have opted for the convenient money policies with close to zero rates and bulk quantitative easing since the global meltdown despite its failure to boost the economy. The artificial liquidity created by quantitative easing has set the stock markets on fire. At the same time, this deficit financing is bringing down the value of the major currencies.
The UltraShort Euro ETF (EUO), the Guggenheim CurrencyShares British Pound Sterling Trust ETF (FXB), and the UltraShort Yen ETF (YCS) dipped 6.1%, 11.8%, and 30.4% YTD, respectively. The Guggenheim CurrencyShares Euro Trust ETF (FXE) and the Guggenheim CurrencyShares Japanese Yen Trust ETF (FXY) recorded growth of 2.3% and 17.6% YTD, respectively.
