Ford Motor Elects John Weinberg to Its Board of Directors
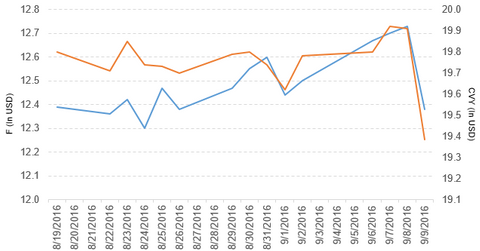
Ford Motor (F) fell 0.96% to close at $12.38 per share during the first week of September 2016.
Nov. 20 2020, Updated 12:16 p.m. ET

Price movement
Ford Motor (F) fell 0.96% to close at $12.38 per share during the first week of September 2016. The stock’s weekly, monthly, and year-to-date (or YTD) price movements were -0.48%, 1.1%, and -7.2%, respectively, as of September 9. Ford is trading 0.61% below its 20-day moving average, 2.6% below its 50-day moving average, and 2.9% below its 200-day moving average.
Related ETFs and peers
The Guggenheim Multi-Asset Income ETF (CVY) invests 0.88% of its holdings in Ford Motor. The ETF tracks the Zacks Multi-Asset Income Index. The index aims to outperform the Dow Jones US Select Dividend Index using US stocks, ADRs (American depositary receipts), REITs, MLPs, CEFs (closed-end funds), preferred stocks, and royalty trusts. The YTD price movement of CVY was 7.9% on September 9.
The First Trust Large Cap Value AlphaDex ETF (FTA) invests 0.83% of its holdings in Ford Motor. The ETF tracks an index that selects and weights value stocks from the S&P 500 Value Index using fundamental factors including sales, book value, and cash flows. The market caps of Ford Motor’s competitors are as follows:
Latest news on Ford
John S. Weinberg has been elected to Ford’s board of directors, effective October 1, 2016. The company added that “Weinberg will serve on the Ford Board of Directors’ Nominating and Governance, Sustainability and Innovation, and Finance Committees.”
Ford’s sales in August 2016
Ford Motor (F) reported total vehicle sales of more than 214,000 units, a fall of 8.4% from August 2015.
- The Ford brand reported sales of just over 205,000 units, a fall of 9.0% from August 2015. This includes the Focus, Explorer, Escape, and F-Series trucks, which had sales fall 27.9%, 15.5%, 2.8%, and 6.1%, respectively. Sales of transit trucks rose 16.9%.
- The Lincoln brand reported sales of 9,243 units, which includes MKZ cars. This is a rise of 7.0% from August 2015. MKX and SUV (sport utility vehicle) sales rose 7.1% and 49.9%, respectively.
The following is a breakdown of Ford’s sales:
- cars reported sales of ~52,000 units, a fall of 25.4% from August 2015
- SUVs reported sales of nearly 74,000 units, a fall of 0.84% from August 2015
- trucks reported sales of over 88,000 units, a fall of 1.6% from August 2015
Ford reported sales of 126,834 units in Asia-Pacific, a rise of 22% from August 2015.
Sales in China were as follows:
- Ford and its joint ventures reported sales of 96,450 units, a rise of 22.0% from August 2015
- Changan Ford Automobile (CAF) reported sales of 75,228 units, a rise of 26% from August 2015, and sales of 578,947 units YTD, a rise of 13.0% from the same period of the previous year
- Jiangling Motor (JMC) reported sales of 19,951 units, a rise of 16% from August 2015, and sales of 159,213 units YTD, a fall of 3% from the same period of the previous year
Next, we’ll look at Avon Products (AVP).
