Why REITs Tend to Offer High Dividend Yields
REITs (IYR)(VNQ) are known for their high dividend yields, outclassing almost all other broad market indices.
Sept. 21 2016, Updated 10:05 a.m. ET

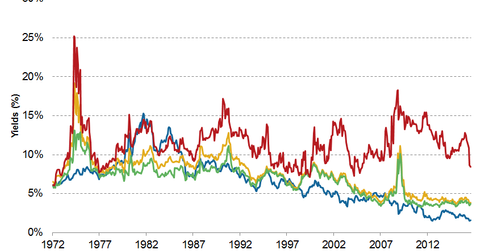
COMPARING DIVIDEND YIELDS ACROSS ASSET CLASSES
Since 1999, approximately half of the total return of the Dow Jones U.S. Select REIT Index has come from dividends. During periods of heightened volatility, this income could act as a buffer and may mitigate negative price movements.
Historically, the Dow Jones U.S. Select REIT Index has produced higher dividend yields than the S&P 500. Since 1999, this has resulted in an additional 2.92% in yield pickup on average. More recently, the gap has narrowed to approximately 1.32%. In a low-yield environment, however, this difference remains significant.
Bonds have provided approximately 1.58% higher yields than REITs since 1999. However, bonds and REITs offer different risk/reward profiles. Most notably, bonds typically provide a promise of repayment at par, which can act as a limiting factor on both their upside and downside price movements. If investors purchase bonds at par and hold them to maturity, they know in advance that the rate of return is equal to the coupon and that 100% of the total return will come from income. REITs, on the other hand, have historically generated approximately 50% of their total return from income and 50% of their total return from capital appreciation, which is why bonds are typically not considered good substitutes for REITs.
Market Realist’s View
As we discussed in the previous part of this series, REITs (IYR)(VNQ) are known for their high dividend yields, outclassing almost all other broad market indices. The graph above shows the dividend and capital gains from 1990 to 2015 for both the S&P 500 (VTI) and the FTSE NAREIT All US Equity REIT index. Dividend yields for REITs have exceeded both US equities and bonds (BND) over the long term.
According to the NAREIT T-Tracker, REITs (RWR) posted strong earnings in 1Q16. The total funds from operations (or FFO) of all listed equity REITs grew by a sound 7.1% to $14.5 billion in 2Q16 from $13.5 billion in 1Q16. This growth represented a 10.3% increase from the FFO of $13.1 billion recorded in 2Q15. According to the NAREIT T-Tracker, dividends or total distributions to investors by listed equity and mortgage REITs increased 13.6% on a year-over-year basis to $12 billion.
The occupancy rate of properties owned by all listed equity ETFs hit an all-time high of 93.7% at the end of the second quarter, a 60 basis point increase from the previous quarter. [1. Source: NAREIT]
