Avon’s Beauty Sales Show Fewer Are Dolling Up with Its Products
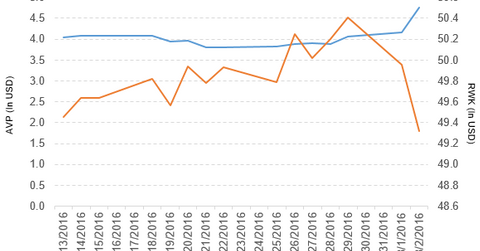
Avon Products (AVP) has a market cap of $2.1 billion. It rose by 14.4% to close at $4.76 per share on August 2, 2016.
Aug. 4 2016, Published 12:51 p.m. ET

Price movement
Avon Products (AVP) has a market cap of $2.1 billion. It rose by 14.4% to close at $4.76 per share on August 2, 2016. The stock’s weekly, monthly, and year-to-date (or YTD) price movements were 22.4%, 20.2%, and 17.5%, respectively, on the same day.
AVP is trading 20.9% above its 20-day moving average, 20.0% above its 50-day moving average, and 23.4% above its 200-day moving average.
Related ETFs and peers
The Oppenheimer Mid-Cap Revenue (RWK) invests 0.75% of its holdings in Avon. The ETF tracks a revenue-weighted index of the S&P Mid Cap 400 Index. The YTD price movement of RWK was 8.9% on August 2.
The iShares Morningstar Small Value ETF (JKL) invests 0.35% of its holdings in Avon. The ETF tracks a market-cap-weighted index of US small-cap value stocks. The index stocks from the 90th to 97th percentile of the market-cap spectrum, using fundamental factors.
The market caps of Avon Products’s competitors are as follows:
Performance of Avon Products in 2Q16
Avon Products reported 2Q16 total revenue of ~$1.4 billion, a fall of 8.3% compared to total revenue of ~$1.6 billion in 2Q15. Sales of its Beauty and Fashion and Home categories fell by 7.5% and 7.3%, respectively, in 2Q16 compared to 2Q15.
Revenue from EMEA (Europe, Middle East & Africa), South Latin America, North Latin America, and Asia Pacific fell by 2%, 12%, 5%, and 10%, respectively, in 2Q16 compared to 2Q15. The company’s cost of sales as a percentage of total revenue and operating income rose by 0.89% and 6.0%, respectively, in 2Q16 compared to 2Q15.
Its net income rose to $33.0 million, and EPS (earnings per share) fell to $0.06 in 2Q16 compared to net income and EPS of $28.8 million and $0.07, respectively, in 2Q15. It reported adjusted EPS of $0.07 in 2Q16, a fall of 22.2% compared to 2Q15.
AVP’s cash and cash equivalents and inventories rose by 7.9% and 6.7%, respectively, in 2Q16 compared to 4Q15. Its current ratio rose to 1.5x in 2Q16 compared to 1.1x in 4Q15.
Now, we’ll discuss Bunge Limited.
