iShares Morningstar Small-Cap Value
Latest iShares Morningstar Small-Cap Value News and Updates
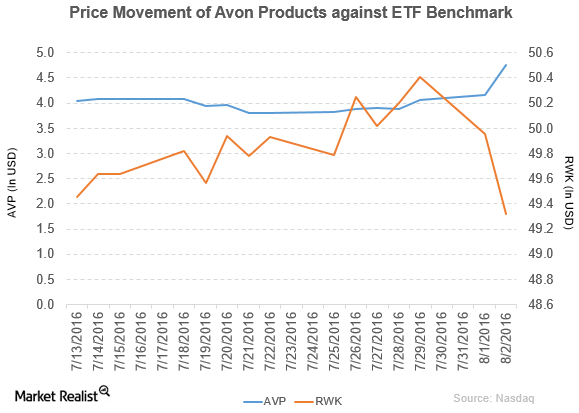
Avon’s Beauty Sales Show Fewer Are Dolling Up with Its Products
Avon Products (AVP) has a market cap of $2.1 billion. It rose by 14.4% to close at $4.76 per share on August 2, 2016.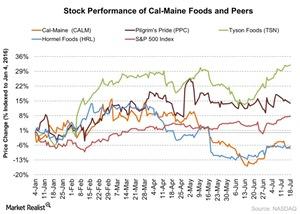
How Did Cal-Maine Foods Stock React to Its Fiscal 4Q16 Results?
Cal-Maine Foods reported its fiscal 4Q16 results on July 18. There wasn’t impact on the stock price even though the company reported a loss for the quarter.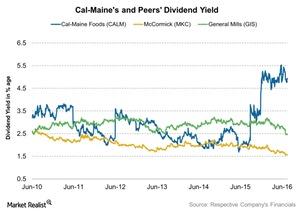
How Much Did Cal-Maine Return to Shareholders in Fiscal 2016?
Cal-Maine Foods has a dividend yield of 4.0% as of July 18, 2016. Management raised the dividend at a CAGR (compound annual growth rate) of 15.3% over five years.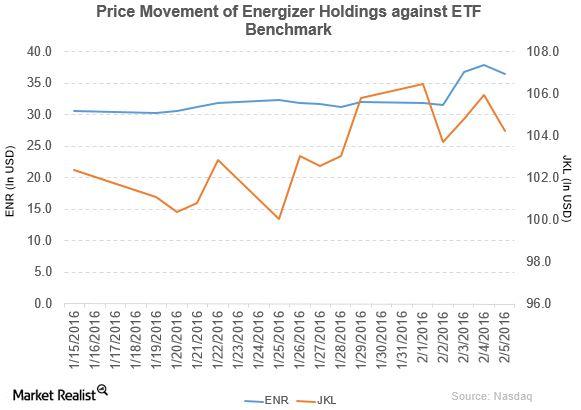
Energizer Revenue and Income Rose in Fiscal 1Q16
Energizer Holdings (ENR) rose by 13.7% to close at $36.43 per share at the end of the first week of February 2016.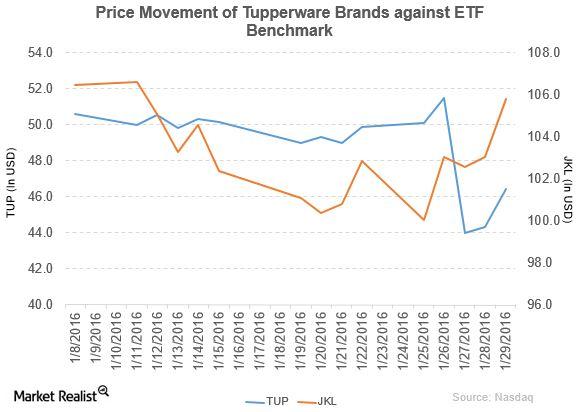
Tupperware Brands’ Revenue and Income Fell in 4Q15
Tupperware Brands (TUP) fell by 6.9% to close at $46.43 per share at the end of the last week of January 2016.