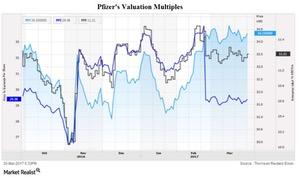
How Does Pfizer’s Valuation Compare to Peers?
Pfizer (PFE) reported an 8% increase in revenues to $52.8 billion for 2016 as compared to $48.9 billion for 2015.
March 31 2017, Published 5:55 p.m. ET

A look at Pfizer’s valuation
Headquartered in New York City, Pfizer (PFE) is one of the largest pharmaceutical companies by revenue. The company reported an 8% growth in revenues to $52.8 billion for 2016 as compared to $48.9 billion for 2015.
The fundamental factors affecting stock prices and valuation include the performance of existing products, new and existing collaborations, acquisitions and divestments, and other factors including results of clinical trials and product approvals. From an investor’s point of view, the two best valuation multiples used for valuing companies like Pfizer are forward PE (price-to-earnings) and forward EV/EBITDA multiples, considering the company’s relatively stable earnings.
Forward PE
PE multiples represent what one share can buy for an equity investor. Pfizer was trading at a forward PE multiple of ~13.2x on March 30, 2017, as compared to the industry average of ~16.2x. Competitors such as Johnson & Johnson (JNJ), Eli Lilly (LLY), and Merck (MRK) have forward PE multiples of 17.6x, 20.2x, and 16.3x, respectively.
Forward EV/EBITDA
On a capital-structure-neutral basis, Pfizer currently trades at ~10.2x, which is much lower than the industry’s average of ~11.4x. Other competitors such as Johnson & Johnson (JNJ), Eli Lilly (LLY), and Merck (MRK) have forward EV/EBITDA (enterprise value to earnings before interest, taxes, depreciation, and amortization) multiples of 11.9x, 14.4x, and 9.7x, respectively.
To divest the risk, investors can consider ETFs like the iShares S&P Global 100 ETF (IOO), which holds 2.0% of its total assets in Pfizer, 3.1% of its total assets in Johnson & Johnson (JNJ), 1.8% of its total assets in Merck (MRK), and 2.0% of its total assets in Novartis (NVS).
