How a Fall in Crack Spreads Is Hurting Refining MLPs
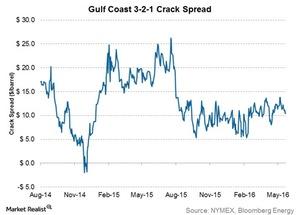
The Gulf Coast 3-2-1 crack spread was $10.4 per barrel on June 16, 2016.
Nov. 20 2020, Updated 11:28 a.m. ET

How crack spreads impact MLPs
The Gulf Coast 3-2-1 crack spread was $10.4 per barrel on June 16, 2016. The year-to-date average spread is $10.0 compared to an average of $15.0 per barrel in 2015. The fall in the crack spreads reflects the recovery in crude oil prices without a proportionate rise in the prices of refined products, especially gasoline, in 2016. This hurts the profitability of refining MLPs such as Alon USA Partners (ALDW), Calumet Specialty Products Partners (CLMT), Northern Tier Energy (NTI), and CVR Refining (CVRR), as their input costs rise more than their revenues rise.
Crack spreads
The above graph shows the Gulf Coast 3-2-1 crack spread over the last two years. The Gulf Coast region accounts for more than 50% of the total US refining capacity. The refining process basically involves transforming crude oil into refined products such as gasoline, diesel, and fuel oils. The crack spread measures the difference between refined product and crude oil prices. The Gulf Coast 3-2-1 crack spread is a popular crack spread measure.
The Gulf Coast 3-2-1 crack spread assumes that refining three barrels of crude oil will produce two barrels of gasoline and one barrel of distillate fuel. It’s calculated by deducting the price of three barrels of WTI (West Texas Intermediate) Cushing crude oil from the combined price of two barrels of Gulf Coast conventional gasoline and one barrel of Gulf Coast ultra-low sulfur diesel. Read more about it in Crack Spread 101: What’s a crack spread?
Crack spreads vary according to region due to the regional differences in crude oil and refined products prices.
Next, we’ll see what Wall Street analysts currently recommend for CVRR.
