Can Airline Capacity Utilization Improve Going Forward?
Airline capacity utilization is measured using the passenger load factor, which is calculated by dividing traffic numbers by capacity numbers.
Dec. 4 2020, Updated 10:52 a.m. ET

What’s the load factor?
Airline capacity utilization is measured using the passenger load factor, which is calculated by dividing traffic numbers by capacity numbers.
Analyzing airline load factors
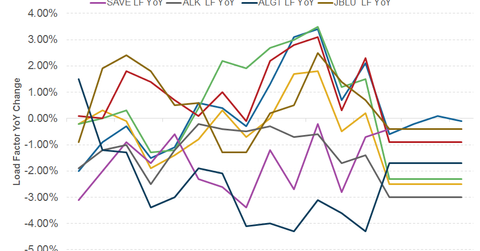
Aggressive capacity growth has had an adverse effect on utilization in 2016, which has resulted in falling utilizations for most airline players. The trend continued in May 2016.
Legacy carrier United Airlines (UAL) saw the largest fall of ~1.4% year-over-year (or YoY) in its load factor. American Airlines’ (AAL) load factor also fell by 0.9%. Delta Airlines (DAL), which had witnessed an improvement in 1Q16, fell by 0.1% in May 2016.
Alaska Air Group (ALK), a niche legacy player, continued to improve its utilization for the third consecutive month. Its load factor rose by 1.7% in May 2016.
In the regional carrier group, JetBlue Airways (JBLU) saw the highest fall of 1.4%. Allegiant Travel (ALGT) saw its load factor slip by about 0.9%. Spirit Airlines’ (SAVE) load factor improved by 0.6% after falling by 0.4% in April 2016.
Southwest Airlines (LUV) has been the only carrier to see positive change in its load factor in 2016 (except in February 2016), despite strong traffic and capacity growths. LUV witnessed a 1.4% improvement in its utilization.
What can we expect?
With the low oil price environment expected to continue for at least the next few months, airlines will continue to take advantage by restructuring their fleets. This could result in their load factors or utilizations remaining under pressure until capacity growth falls below airline demand growth.
Investors can gain exposure to airline stocks by investing in the iShares Transportation Average ETF (IYT), which invests ~20% in airline stocks.
