What’s the Best Approach for Valuing American Airlines?
For airlines such as American Airlines (AAL), we go a step further and use an EV+ Op. leases-to-EBITDAR ratio.
June 24 2016, Updated 9:04 a.m. ET

Determining the valuation multiple
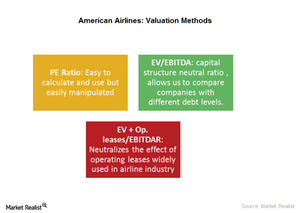
In this part of the series, we’ll look at the following three methods you can use to value AAL:
- forward PE (price-to-earnings)
- forward EV-to-EBITDA (enterprise value to earnings before interest, taxes, depreciation, and amortization)
- forward EV + Op. (operating) leases-to-EBITDAR (earnings before interest, taxes, depreciation, amortization, and rent)
Forward PE
A forward PE ratio is calculated by dividing a company’s current stock price by the earnings estimate for the next 12 months. The major advantage of a PE ratio is that it’s easy to calculate and thus very widely used.
However, one of the major drawbacks of a PE ratio is that EPS (earnings per share) is subject to distortions from differences in capital structures and accounting rules. Also, earnings are highly prone to manipulations. With a forward PE ratio, an added disadvantage is errors related to analyst estimates.
Despite these disadvantages, most market participants track a company’s earnings and use PE ratio, usually for first-level analysis. That’s why it’s important to keep a track of this ratio.
EV-to-EBITDA
For a capital-intensive industry such as airlines, we use an EV-to-EBITDA ratio, because companies often end up taking varying levels of debt. EV-to-EBITDA is a capital-structure-neutral ratio. It takes both equity and debt capital into account. Using this ratio allows us to compare companies with various debt levels.
EV + Op. leases-to-EBITDAR
For airlines such as American Airlines (AAL), we go a step further. Airlines often use operating leases to buy aircraft, resulting in huge rents paid. To neutralize this, we use the EV+ Op. leases-to-EBITDAR ratio to value airline companies. We use the forward EV+ Op. leases-to-EBITDAR multiple. A forward multiple uses the next 12-month estimate.
You can gain coverage to airline stocks by investing in the iShares Transportation Average (IYT), which holds 4.2% in Alaska Air (ALK), 3.9% in United Continental (UAL), 3.8% in Southwest Airlines (LUV), 3.6% in Delta Air Lines (DAL), 2.8% in American Airlines (AAL), and 1.7% in JetBlue Airways (JBLU).
In the next and final part of our series, we’ll see how American Airlines’ valuation has changed over the years.
