How Oil Rigs Impact Natural Gas Production
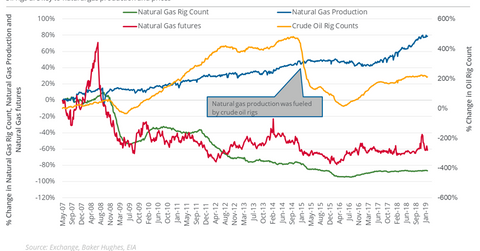
The natural gas rig count was at 187 last week. The natural gas rig count has fallen ~88.4% from its record level of 1,606 in 2008.
Nov. 20 2020, Updated 1:14 p.m. ET

Natural gas rig count
The natural gas rig count was at 187 last week—two less than the previous week. The natural gas rig count has fallen ~88.4% from its record level of 1,606 in 2008.
Oil rigs impact natural gas prices
Between January 2008 and January 2019, US natural gas’s marketed production rose ~67.2% despite the falling natural gas rig count. As a result of the increased supply, natural gas active futures have fallen 68.7% since January 2008.
Rising US oil production is the key factor behind the increase in natural gas supplies. Since natural gas is often a by-product of US shale oil production, it’s important to monitor the oil rig count to understand natural gas supplies.
Crude oil rig count
Between January 4, 2008, and April 18, 2018, the oil rig count more than doubled. Based on the relationship between oil prices and the oil rig count, the oil rig count is expected to keep rising until at least March. Last week, the oil rig count fell by eight to 825—nine higher than the lowest level since April 13. Oil rigs are lower than the multiyear high of 888 in the week ending November 16. The lower oil rig count is a positive development for natural gas prices.
Based on the drilling productivity report from the U.S. Energy Information Administration on April 15, the natural gas production in major US shale regions could rise 17.2% year-over-year in May. Natural gas bears might appreciate the increased supply, which could impact natural gas’s rise.
Energy stocks and energy ETFs
In the trailing week, natural gas–weighted stocks Chesapeake Energy (CHK), Southwestern Energy (SWN), and Range Resources (RRC) returned 2.6%, -9.4%, and -6.6%. During this period, natural gas May futures fell 4.7%.
In the seven days ending on April 23, the SPDR S&P Oil & Gas Exploration & Production ETF (XOP) and the Energy Select Sector SPDR ETF (XLE) rose 2.1% and 1.3%, respectively. These ETFs contain natural gas producer stocks that could be sensitive to the oil and gas rig counts.
