How Nike Has Sustained Profitability despite Headwinds
Nike’s profitability in fiscal 3Q16 was helped by better-than-average performance in North America and Greater China, two of its most profitable segments.
Nov. 22 2019, Updated 6:31 a.m. ET

Nike’s gross margin in fiscal 3Q16 comes ahead of guidance
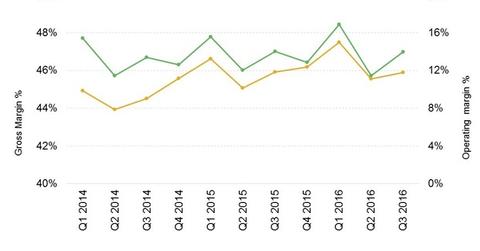
Nike’s (NKE) margins were flat in fiscal 3Q16 compared to the comparable quarter of the previous year. Its gross margin remained unchanged at 45.9%, better than the company’s guidance of a 50-basis-point fall on a year-over-year basis.
Higher demand creation expenses
Nike’s selling, general, and administrative costs rose in tandem with its sales, registering 8% growth in the quarter. Nike incurred higher demand creation expenses in the quarter, up 10% over fiscal 3Q15, partly as a result of its marketing campaigns on the Super Bowl and the women-oriented digital campaigns Better for It and Margo vs Lily.
However, these expenses were compensated as other operating costs leveraged slightly, keeping the company’s operating profit margin unchanged at ~14% in the quarter compared to the previous year’s quarter.
Nike’s profitability in fiscal 3Q16 was also helped by better-than-average performance in North America and Greater China, two of Nike’s most profitable segments.
How profitable is Nike?
Nike’s operating income margin of ~14% in the trailing-12-month period compares to 11.2% for Skechers (SKX), 7.5% for Wolverine Worldwide (WWW), and 6.3% for Adidas (ADDYY) (ADS.DE). Nike’s strong global brand and innovation tradition have allowed it to charge premium prices over a sustained period of time, benefiting its profitability.
In contrast, the S&P 500 Index (SPY) (IVV) (VOO) and the S&P 500 Consumer Discretionary Sector Index (XLY) (FXD) average operating income margins of ~12% and 10.9%, respectively, over the trailing-12-month period.[1. As on March 4, 2016]
NKE makes up 0.77% of the portfolio holdings of the iShares S&P 100 ETF (OEF).
