Where Does Mosaic Stand on the Cost Curve for Its Fertilizers?
Fertilizer prices and input costs affect all players in the industry. Survival and profitability come down to where a company stands on the cost curve.
March 29 2016, Published 2:17 p.m. ET

Cost curve
Previously, we saw how the prices of DAP (diammonium phosphate) and MOP (muriate of potash), two of the most widely used phosphate and potash fertilizers, have an impact on Mosaic’s (MOS) net sales. Then we saw how the cost of raw materials has been trending.
Fertilizer prices and input costs also affect other players in the industry (NANR). Survival and profitability come down to where a company stands on the cost curve.
DAP cost curve
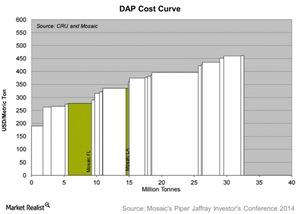
Mosaic stands on the lower half of the global DAP cost curve, with its production cost per ton at around $275 per metric ton. In 2015, the company’s average selling price for DAP was $443 per metric ton, which roughly translated into a gross profit of $168 per metric ton.
Note that the average prices are set by the marginal producers, meaning the producers on the far right of the chart above. A price of $443 per ton would put the global demand for DAP at around 26 million–30 million tons.
MOP cost curve
It costs Mosaic about $157 to produce one metric ton of MOP. This includes about $25 in brine management costs, without which Mosaic’s costs would be close to those of other producers on the lower half of the MOP cost curve. This includes companies such as PotashCorp (POT), Agrium (AGU), and Intrepid Potash (IPI).
The global demand for MOP in 2015 was about 58 million–60 million metric tons. Mosaic’s MOP average selling price in 2015 was $273 per metric ton, giving it about $115.5 per metric ton in gross margins.
With this, let’s look at Mosaic’s gross margins in more detail.
