Tupperware Brands’ Revenue and Income Fell in 4Q15
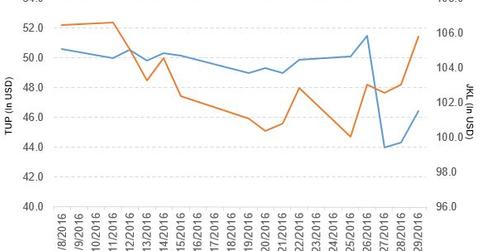
Tupperware Brands (TUP) fell by 6.9% to close at $46.43 per share at the end of the last week of January 2016.
Feb. 2 2016, Published 11:31 a.m. ET

Price movement on Tupperware
Tupperware Brands (TUP) fell by 6.9% to close at $46.43 per share at the end of the last week of January 2016. The stock’s price movements on a weekly, monthly, and year-to-date (or YTD) basis are -6.9%, -17.4%, and -16.6%, respectively.
Technically, the stock has broken its support and is trading below all of its moving averages. Currently, TUP is trading 8.5% below its 20-day moving average, 13.4% below its 50-day moving average, and 18.9% below its 200-day moving average.
The iShares Morningstar Small Value ETF (JKL) invests 0.60% of its holdings in Tupperware. The ETF tracks a market-cap–weighted index of US small-cap value stocks. The index selects stocks from the 90th–97th percentile of the market-cap spectrum using fundamental factors. The YTD price movement of JKL is -10.2% as of January 28, 2016.
The competitors of Tupperware Brands and their market capitalizations are as follows:
Performance of Tupperware Brands in 4Q15 and 2015
Tupperware Brands reported 4Q15 net sales of $592.1 million, a fall of 12.9% when compared to net sales of $679.9 million in 4Q14. Net sales for Europe, Asia Pacific, its Beauty North America segment, and South America fell by 17.7%, 12.8%, 18.6%, and 16.8%, respectively, but net sales for its Tupperware North America segment rose by 5.6% in 4Q15 compared to 4Q14.
The company’s net income and EPS (earnings per share) fell to $58.1 million and $1.15, respectively, in 4Q15, compared to $82.3 million and $1.63, respectively, in 4Q14.
The company has declared a regular quarterly dividend of 68 cents per share on its common stock.
2015 results
In 2015, TUP reported net sales of $2,283.8 million, a fall of 12.4% YoY (year-over-year). It reported gains on the disposal of assets of $13.7 million in 2015 compared to $2.7 million in 2014.
Also, the company’s net income and EPS fell to $185.8 million and $3.69, respectively, in 2015, compared to $214.4 million and $4.20, respectively, in 2014. It reported adjusted EBITDA (earnings before interest, tax, depreciation, and amortization) of $389.7 million in 2015.
Meanwhile, its cash and cash equivalents rose by 3.6% in 2015. Its current ratio and long-term debt-to-equity ratio rose to 0.90 and 3.7, respectively, in 2015, compared to 0.85 and 3.3, respectively, in 2014.
The price-to-earnings and price-to-sales ratios of Tupperware Brands are 12.6x and 1.0x, respectively, as of January 29, 2016.
Future outlook
The company has made the following projections for 1Q16 and 2016:
1Q16:
- US dollar sales growth in the range of -12% to -10% compared to the previous year
- GAAP (generally accepted accounting principles) EPS in the range of $0.74–$0.79
- Local currency sales growth in the range of 1%–3% compared to the previous year
- EPS excluding items in the range of $0.81–$0.86
2016:
- US dollar sales growth in the range of -6% to -4% compared to the previous year
- GAAP EPS in the range of $3.81–$3.91
- Local currency sales growth in the range of 3%–5% compared to the previous year
- EPS excluding items in the range of $4.07–$4.17
