An Analysis of the Correlation between XOP and Crude Oil
Here we’ll present the results of a quarterly correlation analysis between crude oil and the SPDR S&P Oil & Gas Exploration & Production ETF (XOP).
Dec. 24 2015, Updated 8:07 a.m. ET

Crude oil and XOP
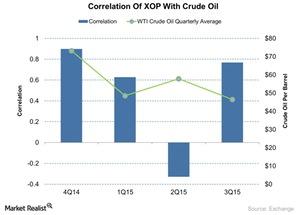
Here we’ll present the results of a quarterly correlation analysis between crude oil and the SPDR S&P Oil & Gas Exploration & Production ETF (XOP). The analysis aims to shed light on how XOP reacted in the recent past to the rise in crude oil prices. The XOP ETF had a negative correlation of about 0.32 with crude oil in 2Q15 even after a 19% surge by crude oil from its 1Q15 quarterly average. The correlation of the ETF with the fall of crude was high and positive from 4Q14 to 3Q15. This simple analysis gives a series of startling statistics.
A crude oil recovery below the quarterly average of $57 may not push the earnings of XOP’s upstream stocks into positive territory. Also, market participants in 2Q15 were expecting crude to stay low for a longer period, and the recovery was seen as short-lived.
As long as crude stays below its quarterly average of $57, the downside movements of crude and XOP are positively correlated compared to upside movements on a quarterly basis. Other major ETFs related to exploration and production companies also followed the same pattern in the second quarter of 2015.
XOP tilts toward crude oil
XOP has a weighted production mix of about 40.0% and 32.8%, respectively, in crude oil and natural gas. However, natural gas was flat during the second quarter of 2015. Moreover, XOP is more sensitive to crude oil as compared to natural gas.
XOP’s top holdings include Sanchez Energy (SN), Energy XXI (EXXI), PDC Energy (PDCE), and Approach Resources (AREX). They have crude oil production mixes of about 54%, 70%, 46%, and 40%, respectively. In the next part, we’ll discuss the moving averages and analysts’ estimates of large-capped frontline upstream companies.
