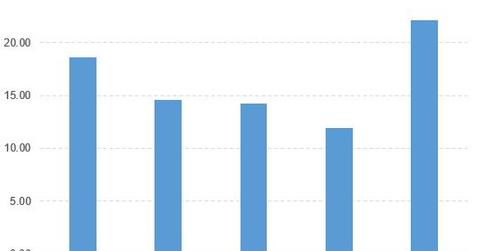
How Does IDEX Compare to Its Peers?
IDEX outperformed its peers based on the PE ratio and PBV ratio. The ETFs outperformed it based on the PE ratio. It’s ahead of its ETFs based on the PBV ratio.
Oct. 21 2015, Updated 9:09 a.m. ET

IDEX and its peers
An analysis of IDEX and its peers follows:
- The PE (price-to-earnings) ratios of IDEX (IEX), Dover (DOV), Xylem (XYL), Flowserve (FLS), and Graco (GGG) are 22.10x, 14.21x, 18.62x, 14.56x, and 11.90x, respectively.
- The PBV (price-to-book value) ratios of IDEX, Dover, Xylem, Flowserve, and Graco are 3.99x, 2.55x, 3.02x, 3.16x, and 5.65x, respectively.
As a result, IDEX outperformed its peers based on the PE ratio and PBV ratio.
ETFs that invest in IDEX
The Guggenheim S&P Global Water ETF (CGW) invests 3.2% of its holdings in IDEX. CGW aims to track a market-cap-weighted index of global water utilities, manufacture, and water equipment and material companies.
The First Trust ISE Water Index Fund (FIW) invests 3% of its holdings in IDEX. FIW tracks a US-listed index of the 36 largest water companies by market cap, weighted equally within five tiers.
The PowerShares S&P MidCap Low Volatility Portfolio (XMLV) invests 1.3% of its holdings in IDEX. XMLV tracks a volatility-weighted index of the 80 least volatile S&P MidCap 400 companies.
Comparing IDEX and its ETFs
An analysis of IDEX and its ETFs follows:
- The YTD (year-to-date) price movement of IDEX, CGW, and FIW are -2.2%, 1.0%, and -14.0%, respectively.
- The PE ratios of IDEX, CGW, FIW, and XMLV are 22.10x, 23.53x, 50.51x, and 20.23x, respectively.
- The PBV ratios of IDEX, CGW, FIW, and XMLV are 3.99x, 2.36x, 1.97x, and 2.22x, respectively.
According to the above findings, the ETFs outperformed IDEX based on the PE ratio. However, IDEX is way ahead of its ETFs based on the PBV ratio.
