Johnson & Johnson’s Revenue Stream Increased in 2014
Johnson & Johnson’s (JNJ) net revenue increased by 4.2% from $71.3 billion in 2013 to $74.3 billion in 2014. There was an operational increase of 6.1%.
March 16 2015, Updated 11:05 a.m. ET

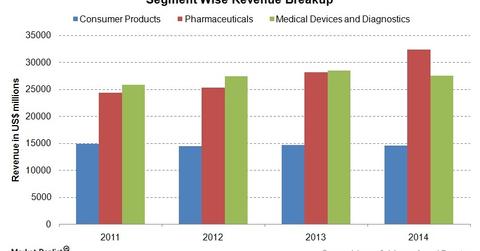
Revenue breakup
Johnson & Johnson’s (JNJ) net revenue increased by 4.2% from $71.3 billion in 2013 to $74.3 billion in 2014. There was an operational increase of 6.1%. The negative impact of currency was 1.9%.
Johnson & Johnson has three segments—Consumer Products, Pharmaceuticals, and Medical Devices and Diagnostics.
Consumer segment
The Consumer segment’s revenue for 2014 was $14.5 billion. It was 1.4% lower than the revenue for 2013. It consisted of an operational increase of 1%. It had a negative impact of 2.4% from currency. Sales in the US decreased by 1.3%. Sales outside the US decreased by 1.4%.
The segment’s positive contributors were the sales of Tylenol and Motrin analgesics, Zyrtec allergy OTC (over-the-counter) products, Aveeno and Neutrogena skin care products, and Listerine oral care products.
Pharmaceuticals segment
The Pharmaceuticals segment’s revenue for 2014 was $32.3 billion. It was 14.9% higher than the revenue for 2013. It consisted of an operational increase of 16.5%. It had a negative impact of 1.6% from currency. Sales in the US increased by 25%. Sales outside the US increased by 5%. The segment’s positive contributors were new products as well as the company’s existing core products.
Medical Devices and Diagnostics segment
The Medical Devices and Diagnostics segment’s revenue for 2014 was $27.5 billion. It was 3.4% lower than the revenue for 2013. It consisted of an operational decrease of 1.6%. It had a negative impact of 1.8% from currency. Sales in the US decreased by 4.3%. Sales outside the US decreased by 2.7%. The segment’s positive contributors were orthopaedic products, cardiovascular care products, biosurgicals, and energy products in the specialty surgery business.
As a percentage of sales, the pre-tax profits for consumer products, pharmaceuticals, and medical devices in 2014 were 13.4%, 36.2%, and 28.9%, respectively.
Other big pharma companies include Pfizer (PFE), Merck & Co. (MRK), and Novartis AG (NVS). These companies are also in diversified segments. However, the percentage contribution of pharmaceuticals is higher for these companies—compared to Johnson & Johnson. Merck & Co. forms about 6.46% of the total assets of the Health Care Select Sector SPDR ETF (XLV).
