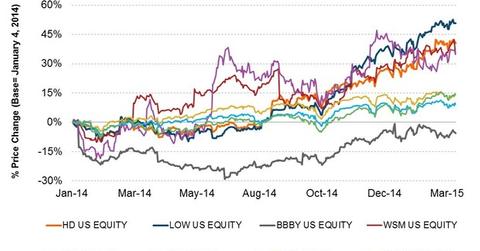
Home Depot Stock Outperforms Peer Group
Home Depot’s (HD) stock has performed well over the past five years. In fact, it’s been the best-performing stock in its peer group.
April 9 2015, Updated 3:05 p.m. ET

Historical returns
Home Depot’s (HD) stock has performed well over the past five years. It has beaten the broader consumer discretionary sector (XLY), the S&P 500 Index (SPY), and the Dow Jones Industrial Average (DIA) by a wide margin. In fact, it’s been the best-performing stock in its peer group over that five-year period.
This year, the stock returned 10.3% compared to a 8.7% return for Lowe’s (LOW) and 5.4% for Williams-Sonoma (WSM).[1. Returns as of March 19, 2015] HD delivered strong 4Q15 and fiscal 2015 results on February 24, 2015. This resulted in a ~4% jump in the stock price on the same day.
Returns volatility
Both HD and LOW are cyclical stocks. HD has a beta of 1.19 and LOW has a beta of 1.38. The S&P 500 Index has a beta of 1.0. Cyclicals tend to perform well when the economy gains traction and vice versa. For more on macro trends and external factors affecting home improvement retailers, read Parts 17 to 20.
Peer group comparison
LOW was the best performer in terms of returns in two of the last three years. The best performers in 2015, however, were Michael’s (MIK) and Rona (RON.TO), which returned 19% and 13.7%, respectively. Michael’s issued shares via an initial public offering last year. Rona is a Canadian home improvement chain that’s seeing a turnaround. Rona reported upbeat numbers in its latest fiscal quarter, with same-store sales rising by as much as 6%.
