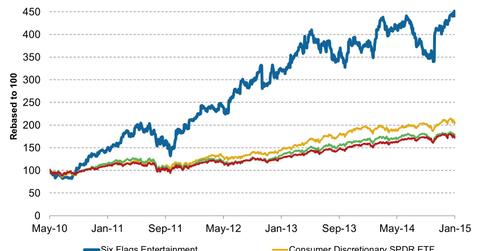
Share price performance for Six Flags since bankruptcy recovery
Six Flags’ share price on May 10, 2010, reflects $7.36 per share, the price of new common stock upon the company’s emergence from bankruptcy.
Nov. 20 2019, Updated 1:01 p.m. ET

Share price performance
In this part, we’ll take a look at the share price performance of Six Flags Entertainment Corp. (SIX) relative to the broader market such as the SPDR S&P MidCap 400 ETF (MDY), the Consumer Discretionary Select Sector SPDR Fund (XLY), and the SPDR S&P 500 ETF (SPY).
Six Flags emerged from Chapter 11 bankruptcy in April 2010 after deleveraging its balance sheet by turning the company’s ownership over to the bondholders. This reorganization wiped out the company’s prebankruptcy shares.
Subsequently, Six Flags listed its newly issued shares on the New York Stock Exchange. As a result, five-year historical data are not presented since the postbankruptcy emergence stock performance of Six Flags is not comparable to the stock performance prior to its emergence from bankruptcy.
The company’s share price on May 10, 2010, reflects the price of $7.36 per share, the price at which Six Flags’ new common stock was issued upon its emergence after giving effect to both the June 2011 and June 2013 two-for-one stock splits.
The above chart shows that if you had invested, let’s say, $100 on May 10, 2010, in Six Flags, you would have made a gain of 341.4% as of January 16, 2015. However, if you had invested in any of the ETFs mentioned above, you would have made a maximum gain of 105.8% during the same time period.
Investors who are willing to invest in the consumer discretionary sector may invest in ETFs such as the iShares Dow Jones U.S. Consumer Services Fund (IYC) and the Vanguard Consumer Discretionary Index Fund (VCR).
