Technical analysis—the rectangle, flag, and pennant patterns
In the rectangle pattern, it’s advisable to buy stock at support and sell at resistance. This pattern is formed in the uptrend and downtrend.
Nov. 27 2019, Updated 4:33 p.m. ET

Rectangle pattern
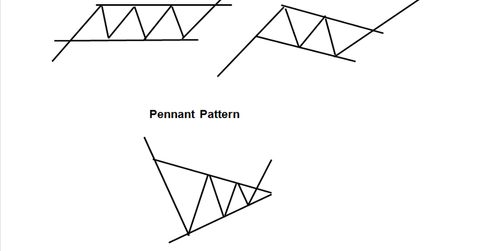
In the rectangle pattern, the price moves in a sideways direction. It forms a rectangular trading range. In this pattern, stock price trade between two horizontal lines. The pattern looks like a rectangle.
The rectangle pattern forms because the stock’s supply and demand forces are at equilibrium. As a result, the prices move in a range. This pattern has a sideways trend that can form from days to years.
In the rectangle pattern, it’s advisable to buy stock at support and sell at resistance. This pattern is formed in the uptrend and downtrend. The pattern breakout or breakdown will define the trend continuation or reversal.
Flags
Flags are formed over short-term periods. They’re a minor continuation pattern. In the flag pattern, prices move between two parallel lines. The pattern looks like a flag.
Flag patterns are formed in the uptrend and downtrend. The breakout or breakdown will be the direction of the major trend. The flag patterns are caused due to minor profit booking. They cause a minor consolidation phase. During the pattern breakout or breakdown there will be an increase in the volume of stocks traded.
Pennants
The pennant pattern looks similar to the symmetrical triangle pattern. When the pattern formation is over a short-term period, it’s called a pennant pattern. When the formation is over a long-term period, it’s called a symmetrical triangle pattern.
Pennants are formed due to minor profit booking. These patterns are formed in the uptrend and downtrend. The breakout or breakdown will be in the direction of the major trend.
All of these patterns are useful for trend identification. They’re also useful for entry and exit signals.
Applying continuation price pattern concepts
In technical analysis, the continuation price pattern concepts can be applied to companies like Range Resources (RRC), Chesapeake Energy (CHK), Occidental Petroleum (OXY), and Linn Energy (LINE). These companies are part of energy exchange-traded funds (or ETFs) like the Vanguard Energy ETF (VDE) and the SPDR S&P Oil & Gas Exploration & Production ETF.
