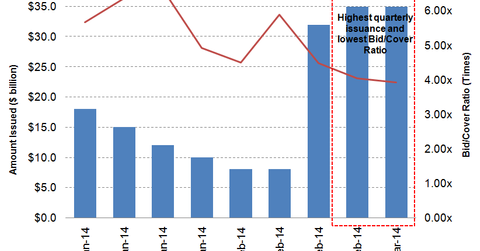
The demand for 4-week Treasury bills remained subdued last week
A considerable amount of $35 billion was offered for the weekly four-week T-bills auctioned on Tuesday, March 4, 2014.
Dec. 4 2020, Updated 10:53 a.m. ET

Auctioned every week, the Treasury bills (T-bills) are short-term debt obligations backed by the U.S. government. T-bills are issued through a competitive bidding process at a discount or at par (face value). Based on the investor’s demand for the bill, interest rates are determined at the auction.
Auction highlights for a four-week Treasury bill
A considerable $35 billion was offered for the weekly four-week T-bill auctioned on Tuesday, March 4, 2014, at a $1,000 face value. The bill was issued at 0.045% discount rate. The bid/cover ratio was 3.93x, down from 4.05x for last week’s $35 billion offering, and the lowest of the quarter.
What does the situation imply?
The four-week T-bill is the most liquid investment available in the fixed income market. The bill was introduced with the notion to meet the investor’s intermittent need for cash.
The interest rates on a one-month T-bill issue have jumped to the 0.04% to 0.05% area since last week. However, the rates were still lower than the February issuance at 0.08% to 0.09%. The Fed has clearly indicated that they are not going to raise the Fed funds rate target until the unemployment level reaches a 6.5% threshold. As per the latest monthly reading on the February 2014, the unemployment level is at 6.7%.
As shown in the chart above, despite the higher short-term liquidity issued by the U.S. government, many money managers in the fixed income market remained skeptical to take up the position in the bills, which were substantiated by the decline in the bid/cover ratio. The bid/cover ratio is an indicator of the strength or demand for a Treasury offering relative to investor bids deemed suitable in the auction process. A higher ratio is an indication of a strong auction, marked by a tight bid-ask spread. On the other hand, a low ratio is an indication of a disappointing auction, marked by a wide bid-ask spread.
The decline in the demand was mainly because of the persistently lower interest rate offered by the four-week T-bill and quick maturity, leaving less time for money managers to liquidate the bill in the secondary market. Second, in February 2014, President Barrack Obama announced the upscale in the U.S. debt ceiling limit through March 2015. The debt ceiling is a governmental method to limit the amount of national debt that can be issued by the Treasury by limiting how much money the government may borrow. The increase in the debt ceiling would allow the U.S. government to meet their short-term borrowing needs. However, with a higher U.S. debt to GDP, many money managers worried on the country’s ability on making the future payments.
Relevant ETF
Investors interested in the short-term money market may consider SPDR Barclays 1-3 Month T-bill ETF (BIL). The ETF has a gross expense ratio of 0.14% and tracks the one–three month sector of the U.S. Treasury Bill market. Last week, the ETF had a fund outflow of $11.8 million, and the one-month outflow reached to $36.4 million. Fund flows are a great barometer to judge investor demand for a particular security and/or market.
Some other popular government T-bill and bonds ETF include: iShares Barclays 20+ Year Treasury Bond Fund (TLT), iShares Short Treasury Bond (SHV), iShares 1-3 Year Treasury Bond (SHY) and iShares 1-3 Year International Treasury Bond (ISHG). Last week iShares Barclays 20+ Yr Treasury Bond Fund (TLT) posted a fund inflows of $7.06 million while iShares Short Treasury Bond (SHV) had a fund outflow of $30.4 million. The iShares 1-3 Year Treasury Bond (SHY) posted a huge outflow of $110.2 million and iShares 1-3 Year International Treasury Bond (ISHG) had a fund inflow of $0.38 million last week.
