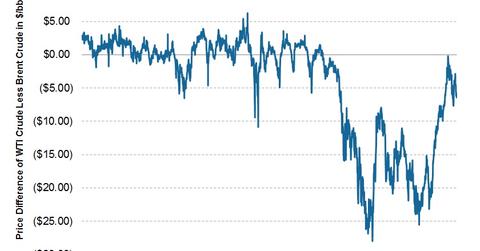
Why the spread between WTI and Brent oil drifted wider
The spread between WTI and Brent closed through most of 2013, but it has experienced some volatility in recent months, given events in Libya and Syria.
Oct. 1 2013, Published 1:44 p.m. ET

WTI and Brent used to trade in line, but prices had diverged over the past few years
The spread between West Texas Intermediate (WTI) and Brent crude represents the difference between two crude benchmarks, with WTI more representing the price that US oil producers receive and Brent more representing the prices received internationally. The two crudes are of similar quality and theoretically should price very close to each other. However, the prices had differed greatly between the two crudes because a recent surge in production in the United States has caused a buildup of crude oil inventories at Cushing, Oklahoma, where WTI is priced. This created a supply and demand imbalance at the hub, causing WTI to trade lower than Brent. Before this increase in US oil production, the two crudes had historically traded in line with each other.
The above graph shows the WTI-Brent spread over the past few years. Note that when the spread moves wider, it generally means crude producers based in the United States receive relatively less money for their oil production compared to their counterparts producing internationally.
Spreads traded slightly wider last week but have seen volatility since mid-July
The WTI-Brent spread traded wider last week, moving from $4.47 per barrel to $5.76 per barrel. WTI traded nearly at par with Brent in mid-July, and since then the spread gradually widened to levels as wide as ~$8 per barrel. One reason is because supply from Libya had dropped sharply due to unrest, which has since begun to recover. Plus, the recent escalation of tensions in Syria had caused traders to take bullish bets on the international oil benchmark of Brent crude and has also possibly driven the price differential between WTI and Brent. Recently, fears about Syria have eased somewhat (please read Recent news on Syria and the oil market’s reaction for more information). But further action in the Middle East could again drive the WTI-Brent spread wider.
Despite recent widening, the spread closed sharply over 2013
Despite recent widening, the spread has moved sharply narrower throughout much of 2013. In early February, WTI traded at points as much as ~$23 per barrel below Brent crude, but the spread had steadily narrowed since then to trade at current levels of near parity. The significant tightening of the spread since February has been a positive for domestic oil producers (relative to international producers), as it means the discount they receive to international crudes has been decreasing.
Over the course of the year, the spread has narrowed due to several factors. Firstly, increased midstream infrastructure has come online that has facilitated the movement of crude from inland to refiners on the coast. One notable example is the expansion of the Seaway Pipeline in January 2013, which allows more crude to flow from the Oklahoma crude hub at Cushing to the Gulf Coast, where a great amount of refining capacity sits. Plus, Sunoco’s Permian Express Pipeline and the reversal of Magellan Midstream Partners’ Longhorn Pipeline are allowing more crude from the Permian Basin in West Texas to flow directly to the Gulf Coast. Increased pipeline capacity and crude transportation by rail have also allowed inland domestic crude to more efficiently travel to refiners on the East and West coasts. This has also backed out Brent-like imports.
US refineries are running at higher rates than earlier in the year. This has caused increased demand for crude. Since spring 2013, many US refineries started to come back online from performing routine maintenance. The EIA reported that domestic refineries were running crude through their facilities at a rate of ~16.3 million barrels per day through June 2013. This is a ~2.1 million-barrel-a-day increase over the first week of March. Plus, new refining capacity opened up in the Gulf Coast, helping increase refiners’ demand for crude.
The future of the Brent-WTI spread
As we’ve seen, WTI and Brent had historically traded at near par. However, given the structural change of significantly more oil being produced from the United States (with projections of continued future growth), many market participants expect WTI to continue to trade under Brent. The US Energy Information Administration, for example, notes in its monthly report titled “Short Term Energy Outlook” that it expects a spread of ~$6 per barrel in 2014.
Again, a wide spread means companies with oil production concentrated in the United States will realize lower prices compared to their international counterparts. For example, see the table below for a comparison of oil prices realized by US-concentrated companies versus companies with a global production profile.
| 2Q13 Average Price Per Barrel | |
| BENCHMARK OIL PRICES | |
| West Texas Intermediate | $94.12 |
| Brent | $102.44 |
| 2Q13 Realized Oil Prices Per Barrel (excluding hedge gains/losses) | |
| DOMESTIC PRODUCERS | |
| Chesapeake Energy (CHK) | $92.53 |
| Concho Resources (CXO) | $89.87 |
| Range Resources (RRC) | $83.87 |
| Oasis Petroleum (OAS) | $91.15 |
| INTERNATIONAL PRODUCERS | |
| Total Corp. (TOT) | $96.60 |
| ConocoPhillips (COP) | $100.07 |
Monitor the spread
Investors may want to monitor the spread, as a wider spread may make international producers more attractive relative to domestic producers. The difference between Brent and WTI has caused domestic producers such as those ones mentioned in the above table (CHK, CXO, RRC, and OAS) to realize lower prices on oil compared to international producers. But over the medium term, the spread has closed dramatically and now signals better takeaway capacity for inland U.S. oil. Investors should note that many international names are in the XLE ETF (Energy Select Sector SPDR), an ETF (exchange-traded fund) whose holdings are primarily large-cap energy stocks with significant international exposure.
