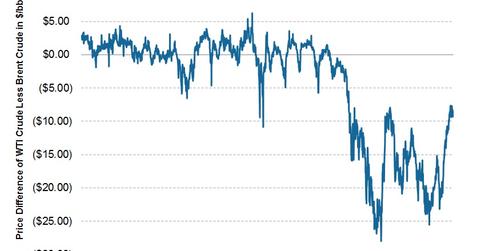
Spread between WTI crude oil and Brent oil has closed in significantly since YE2012
The WTI-Brent spread remained relatively unchanged last week, but has closed in significantly since year-end 2012.
Dec. 4 2020, Updated 10:52 a.m. ET

- International producers receive a price closer to Brent crude while U.S.-based producers receive a price closer to WTI crude, therefore, higher relative Brent prices favor international producers (and vice versa).
- The WTI-Brent spread was roughly flat last week as it moved from $8.49/barrel to $8.42/barrel, despite some widening mid-week.
- Over the medium-term, the spread has closed significantly, moving from over $23.00/barrel to ~$8.50/barrel currently.
- At current levels, there are mixed opinions on where the spread will trade in the medium-term.
The spread between West Texas Intermediate (WTI) and Brent crude represents the difference between two different crude benchmarks, with WTI being more representative of the price that U.S. oil producers receive and Brent being representative of the prices received internationally. In brief, the prices differ between the two crudes because a recent surge in production in the United States has caused a buildup of crude oil inventories at Cushing, Oklahoma where WTI is priced. This has created a supply/demand imbalance at the hub causing WTI to trade lower than Brent. Before this increase in U.S. oil production, the two crudes had historically traded in-line with each other. The above graph shows the WTI-Brent spread over the past few years. Note that when the spread moves wider, it means that crude producers based in the U.S. receives relatively less money for their oil production compared to their counterparts that are producing internationally.
The WTI-Brent spread was roughly flat last week, moving slightly from $8.49/barrel to $8.42/barrel. In early February, WTI traded at points as much as ~$23/barrel below Brent crude, but the spread had steadily narrowed since then to trade at current levels of ~$8/barrel. The significant tightening of the spread since February has been a positive for domestic oil producers (relative to international producers), as it means that the discount they receive to international crudes has been decreasing. From a very long-term perspective (5+ years), the spread is wide as WTI and Brent crudes have historically traded roughly at par.
When the spread was trading at its widest point, most market participants thought that it would close-in in the medium-term. However, given that the spread now trades at roughly ~$8/barrel, some feel the spread may remain where it is or widen back out from here. For example, the EIA (U.S. Energy Information Administration) notes in its monthly report titled “Short Term Energy Outlook” that it expects the spread to average $12.72/barrel in 2013. Year-to-date it has averaged ~$15.00/barrel, and roughly 40% of the year has elapsed which implies that the rest of the year the spread will average ~$11.25/barrel and will, therefore, widen from current levels.
Again, the effect of a wide spread means that companies with oil production concentrated in the U.S. will realize lower prices compared to their international counterparts. For example, see the below table for a comparison of oil prices realized by U.S.-concentrated companies versus companies with a global production profile.
| 1Q13 Average Price Per Barrel | |
| BENCHMARK OIL PRICES | |
| West Texas Intermediate | $94.36 |
| Brent | $112.64 |
| 1Q13 Realized Oil Prices Per Barrel (excluding hedge gains/losses) | |
| DOMESTIC PRODUCERS | |
| Chesapeake Energy (CHK) | $95.23 |
| Concho Resources (CXO) | $82.49 |
| Range Resources (RRC) | $85.46 |
| Oasis Petroleum (OAS) | $93.33 |
| INTERNATIONAL PRODUCERS | |
| Total Corp. (TOT) | $106.70 |
| ConocoPhillips (COP) | $105.97 |
Investors may want to monitor the spread as a wider spread may make international producers more attractive relative to domestic producers. The difference between Brent and WTI has caused domestic producers, such as the ones mentioned in the above table (CHK, CXO, RRC, OAS), to realize lower prices on oil compared to international producers. Last week the spread was relatively unchanged, though it has closed in significantly from YE2012. Despite the medium-term spread closing, WTI still trades significantly below Brent, especially from a long-term historical basis. Therefore, international producers receive significantly more revenue per barrel than domestic producers. Additionally, many international names can be found in the XLE ETF (Energy Select Sector SPDR), an ETF with holdings in primarily large-cap energy stocks with significant international exposure.
