Where Could Natural Gas Prices Close Next Week?
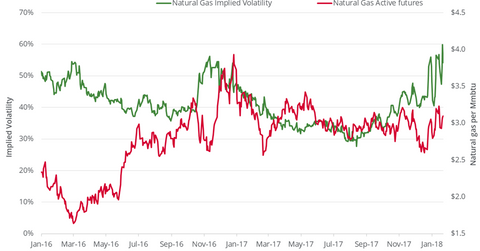
On January 25, 2018, natural gas’s implied volatility was at 54.8%, 8% above its 15-day average.
Jan. 26 2018, Updated 11:13 a.m. ET

Implied volatility
On January 25, 2018, natural gas’s implied volatility was at 54.8%, 8% above its 15-day average.
Sudden large moves in natural gas (GASL) (GASX) (FCG) prices could increase its implied volatility, as the graph above shows. In the trailing week, natural gas’s implied volatility rose 0.6%, and natural gas prices moved up 3.7%.
Natural gas prices
Between January 26 and February 1, 2018, natural gas futures could settle in the range of $2.86 and $3.33 per MMBtu. The probability for this price range is 68%. We calculated this price range from the assumption that prices are normally distributed and using natural gas’s implied volatility of 54.8%.
On January 25, 2018, natural gas prices settled at $3.09 per MMBtu. Any further elevation in natural gas prices from this level would be positive for the natural gas tracking ETFs like the United States Natural Gas ETF (UNG) and the ProShares Ultra Bloomberg Natural Gas (BOIL). On the other hand, a sharp drop would drag these natural-gas-tracking ETFs lower.
